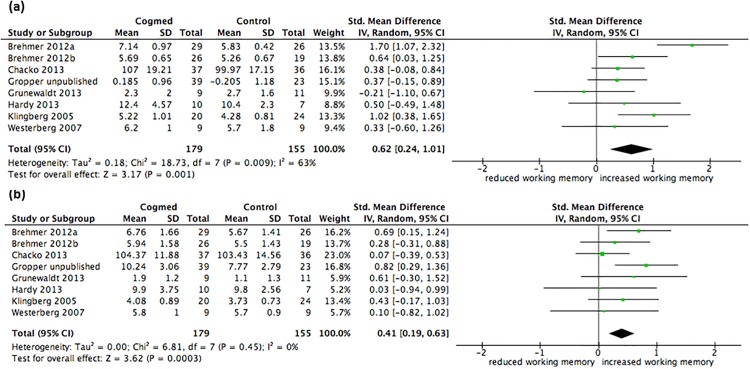
Fig 4. Forest plots for (a) visuospatial working memory performance and (b) verbal working memory performance after training.
The overall pooled effect size (standardised mean difference, displayed as a diamond) as well as individual study effect sizes (displayed as rectangles) and their 95% confidence intervals (represented by horizontal lines) are shown.

