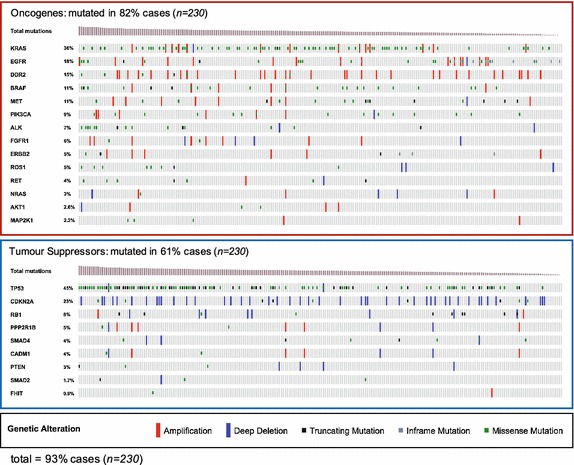
Fig. 1.

Waterfall plots of genetic alterations in The Cancer Genome Atlas lung adenocarcinoma dataset (n = 230). Each column represents an individual patient, colour-coded based on copy number aberration (amplification or deletion) and/or mutational state (truncating mutation, inframe mutation, missense mutation) across profiled oncogenes and suppressors frequently altered in lung adenocarcinoma. Columns are sorted based on total mutational burden. In total, 93% of patients in the dataset are covered by one or more genetic aberration in the 23 genes profiled
