
Fig. 2.
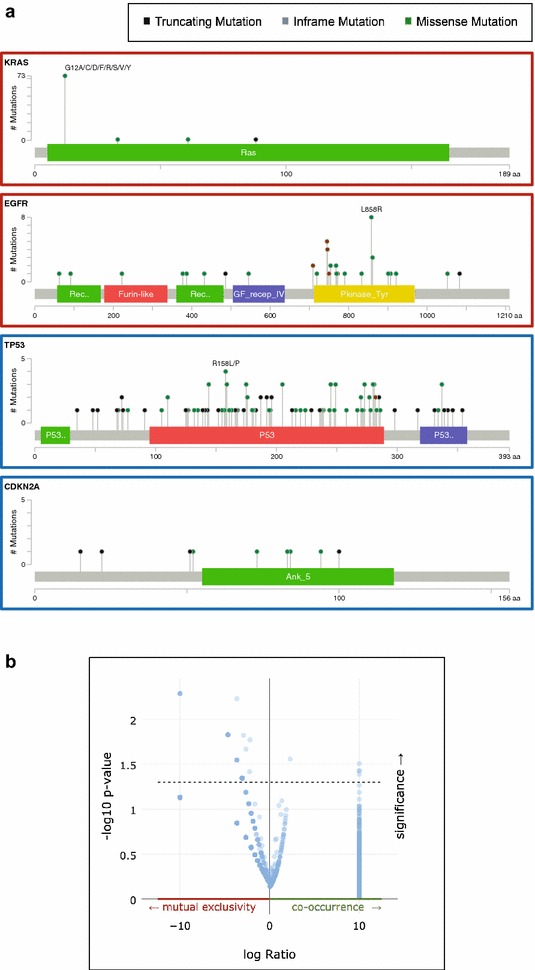
a Lollipop plots showing the distribution of mutations (colour coded as Fig. 1) across the protein-coding regions of the two most commonly mutated oncogenes (KRAS and EGFR) and tumour suppressors (TP53 and CDKN2A). b Volcano plot showing tendency towards mutual exclusivity or co-occurrence of mutations in the 23 genes profiled in Fig. 1