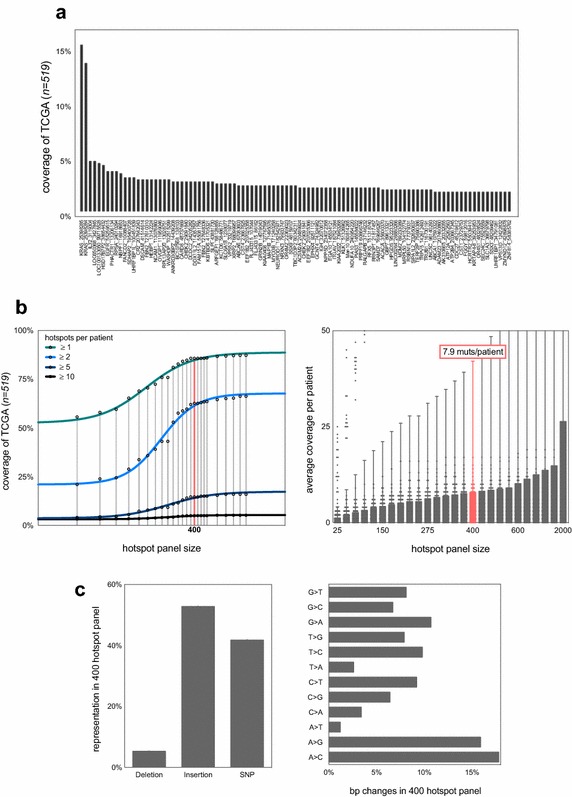
Fig. 3.

a 100 specific loci (“hotspots”) frequently mutated in the lung adenocarcinoma dataset (n = 519) ranked based on shared coverage across the dataset. Annotation is geneID_genomic-start-location. For example, a hotspot region in KRAS starting at 25398285 is mutated in >15% of the TCGA dataset (this is the G12D region depicted in Fig. 2a). b Correlation between the size of a hotspot mutational panel and coverage in the TCGA dataset at specific depths [≥1, 2, 5 or 10 mutations per patient (left panel) and mean depth ± standard deviation (right panel)]. A panel size of 400 hotspots is highlighted for ease of comparison. The top 400 most frequently mutated regions in the dataset cover >75% patients at a depth of one mutation and >50% at a depth of two mutations (left panel); with a mean coverage of 7.9 per patient (right panel). c The composition of this 400 hotspot panel. The panel is dominated by SNVs and insertions (left panel) and is relatively balanced in terms of basepair substitution (right panel)
