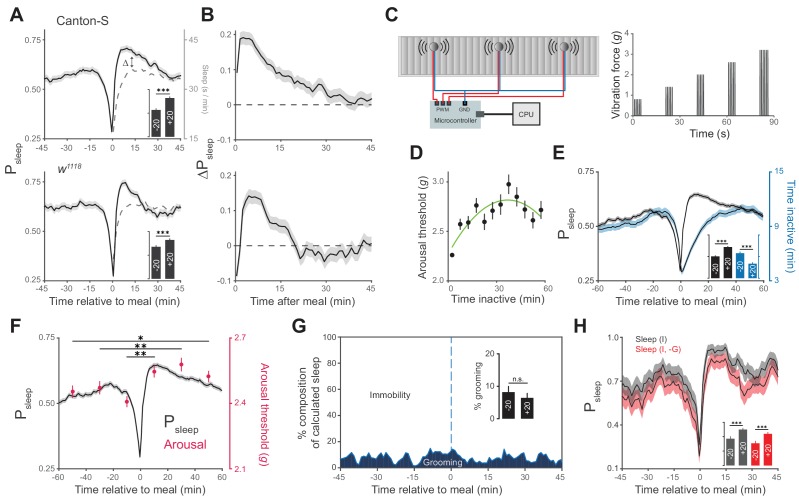
Figure 2. Animals exhibit increased sleep and arousal threshold after eating.
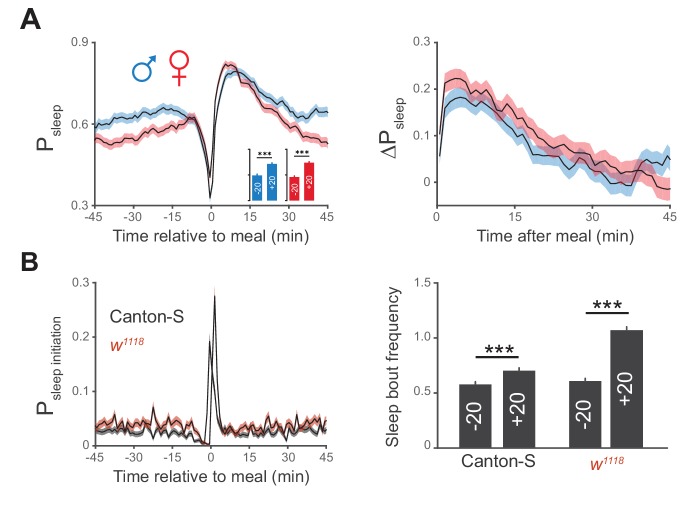
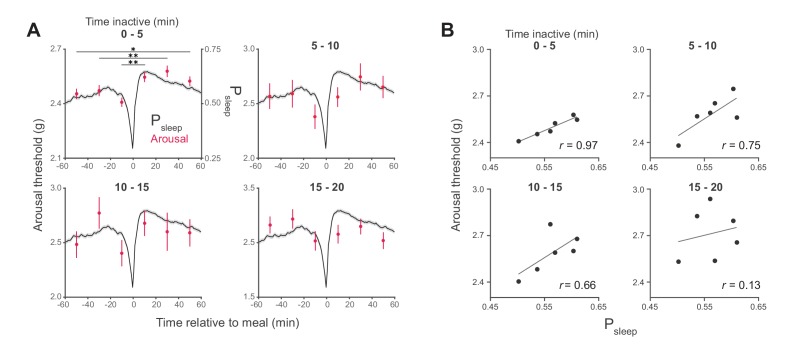
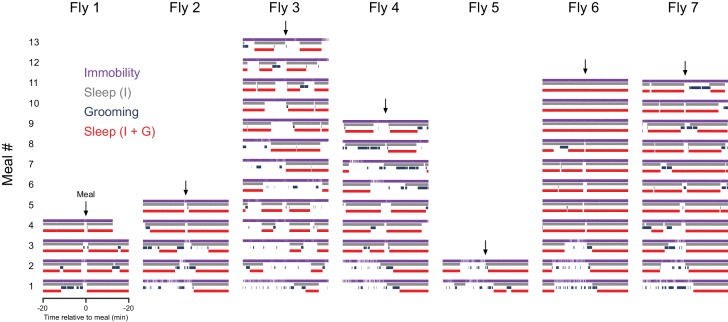
(A) Probability of sleep (Psleep) preceding or following each meal (t = 0) in Canton-S (top) or w1118 (bottom) males. Data are shown as averages of 1 min bins. ΔPsleep is defined as the difference between postprandial Psleep and the corresponding time-matched pre-meal Psleep (i.e. t1 – t−1, t2 – t−2, …). For clarity, a mirror image of pre-meal Psleep is replotted in the postprandial period (dashed line). Inset graphs show average Psleep (± s.e.m.) for the 20 min before (−20) and after (+20) meals, with the axis scaled to the parent graph. n = 757 meals from 50 flies, Canton-S; 661 meals from 30 flies, w1118; ***p<0.001, Wilcoxon matched-pairs sign rank test. (B) ΔPsleep calculated from data in A. (C) Diagram of stimulus delivery system showing shaft-less vibration motors attached to the back of ARC chamber. Increasing vibrations are delivered to the chamber via a microcontroller using pulse width modulation. (D) Arousal threshold shows an initial increase with the time an animal is inactive. 180 flies, 11,479 arousal events, Canton-S; 5 min bins, circles represent mean ± s.e.m., a secondorder polynomial trendline is shown. (E) Superimposition of time inactive (blue) over Psleep (black) relative to meals during periodic vibrational stimuli. The inset graph shows Psleep and time inactive in the 20 min before and after each meal. n = 2245 meals from 180 flies, Canton-S; ***p<0.001, Wilcoxon matched-pairs sign rank test. (F) Stimulus response from 0–20, 20–40, and 40–60 min pre- and post-meal (red) superimposed onto Psleep (black). Arousal events are filtered to 5 min intervals for prior time inactive to control for sleep depth (0–5 mins shown, minimum 1 s inactivity). Circles represent mean ± s.e.m.; n = 2245 meals from 180 flies, Canton-S; *p<0.05, **p<0.01, Mann Whitney test. (G) Percent of calculated sleep that is actual immobility versus grooming. The inset graph shows the percent grooming in the 20 min before and after each meal. n = 55 meals from seven flies, Canton-S; p=0.69, Wilcoxon matched-pairs sign rank test. (H) Comparison of Psleep before and after meals calculated using immobility criteria "I" versus immobility criteria paired with grooming criteria "I, -G". Inset shows average Psleep (± s.e.m.) in the 20 min before and after each meal. ***p<0.001, Wilcoxon matched-pairs sign rank test.


