. 2016 Nov 22;5:e19334. doi: 10.7554/eLife.19334

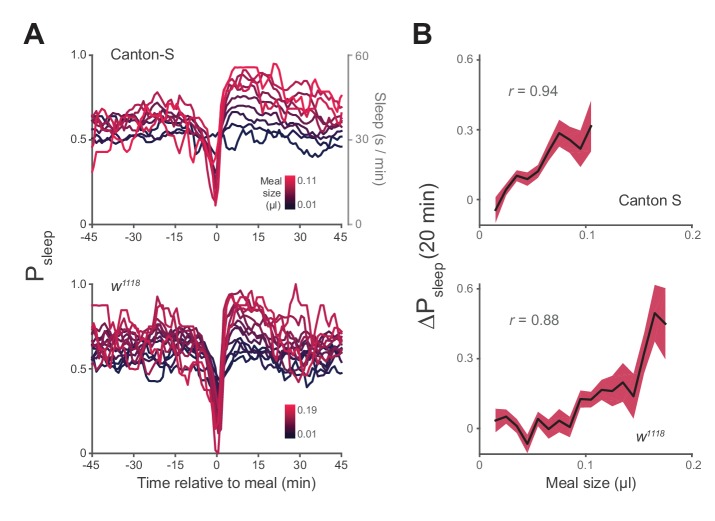
Figure 3. Postprandial sleep correlates with food intake quantity.

(A) Sleep probability of Canton-S and w1118 surrounding meals of varying size (lines represent mean; color grading corresponds to meal size). Only groupings with n > 7 are shown for visualization. (B) 20 min ΔPsleep as a function of meal size for each grouping (Pearson correlation: p<0.001 for Canton-S and w1118.) Shaded lines represent mean ± s.e.m.

DOI: http://dx.doi.org/10.7554/eLife.19334.009

Figure 3.

Figure 3—figure supplement 1. Sleep probability and ΔPsleep response to meal size.
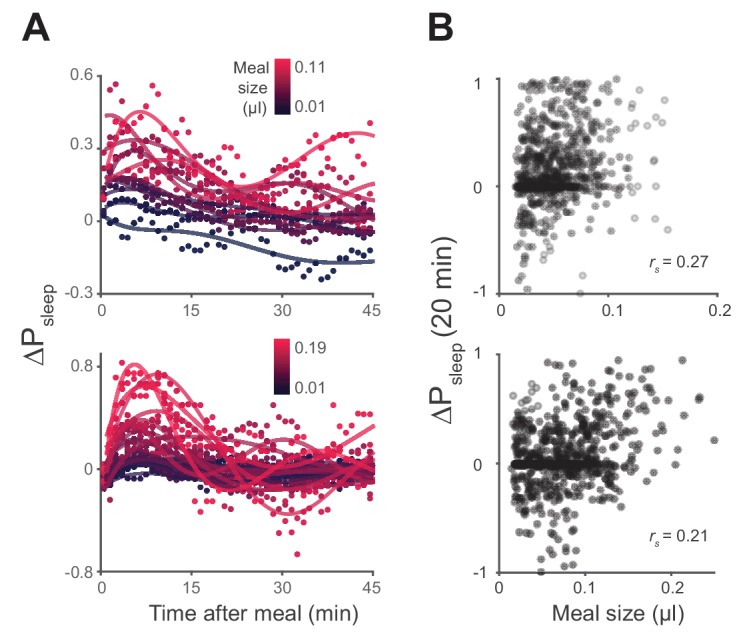
Figure 3—figure supplement 1.

(A) Time-course of ΔPsleep for meals grouped by volume (0.01 µl meal groupings, circles represent 1 min binned averages, lines represent spline fit). (B) Correlation between meal size and ΔPsleep in 20 min after feeding events for Canton-S and w1118 (Spearman rank-order correlation: p=9.0 × 10⁻¹⁴, Canton-S; p=4.1 × 10⁻⁸, w1118).

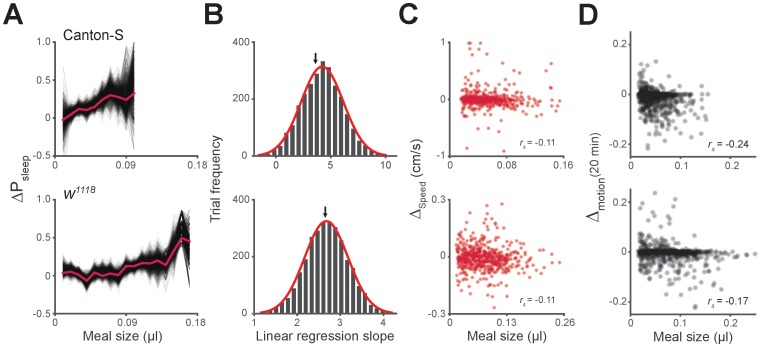
Figure 3—figure supplement 2. Unequal meal sampling frequency and motor ability effects on meal size-sleep correlation.

Figure 3—figure supplement 2.

(A) Monte Carlo simulation of ΔPsleep as a function of meal size using fixed sampling frequency from individual flies. Simulations contained 3000 trials of randomly sampled meals, where thin black lines represent individual trials, and the red line represents the entire data set (three samples/fly, Canton-S; eight samples/fly, w1118; 0.01 µl meal groupings). (B) Histogram of linear regression slope for each trial fit with a Gaussian distribution (red line). The black arrow indicates the slope value of the entire data set. (C) Average Δspeed for the 20 min relative to meals versus meal size (Spearman rank-order correlation: p=0.0096, Canton-S; p=0.0095, w1118).