. 2016 Nov 22;5:e19334. doi: 10.7554/eLife.19334

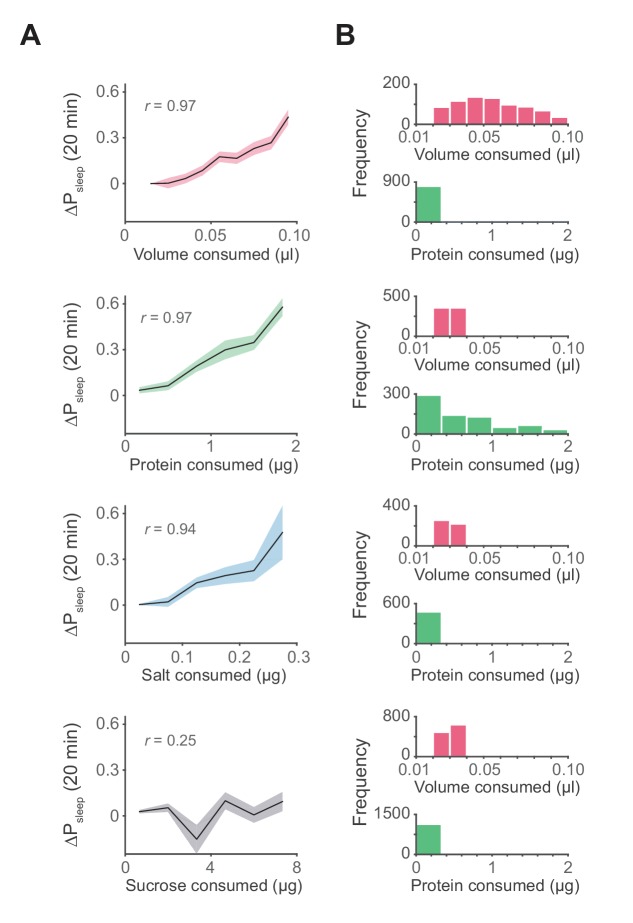
Figure 4. Influence of meal components on postprandial sleep.

(A) Average 20 min ΔPsleep as a function of each meal component (Canton-S, Pearson correlation: p<0.001, volume; p<0.001, protein; p<0.005, salt; p=0.065, sucrose). Shaded lines represent mean ± s.e.m. (B) Histograms representing the distribution of volume and protein consumed in each meal for data from A.

DOI: http://dx.doi.org/10.7554/eLife.19334.012

Figure 4.

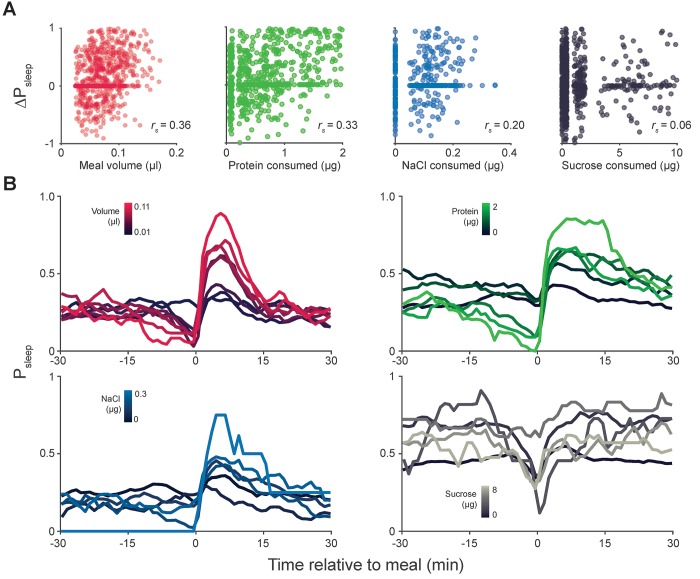
Figure 4—figure supplement 1. Meal component correlates to postprandial sleep.

Figure 4—figure supplement 1.

(A) Scatter plots representing individual meals showing 20 min ΔPsleep versus meal volume or consumed protein, salt (NaCl), or sucrose. Non-normal data in each plot can arise from the tendency for fully awake animals to stay awake (ΔPsleep = 0) and from low variation in nutrient consumption within animals given a low nutrient, fixed diet (protein, NaCl, or sucrose consumption = 0 µg). Spearman rank-order correlation: p=1.52 × 10⁻²⁵, volume; p=1.73 × 10⁻¹⁹, protein; p=6.84 × 10⁻⁶, NaCl; p=0.055, sucrose). (B) Time-courses of sleep probability for component groupings (lines represent mean for each grouping).

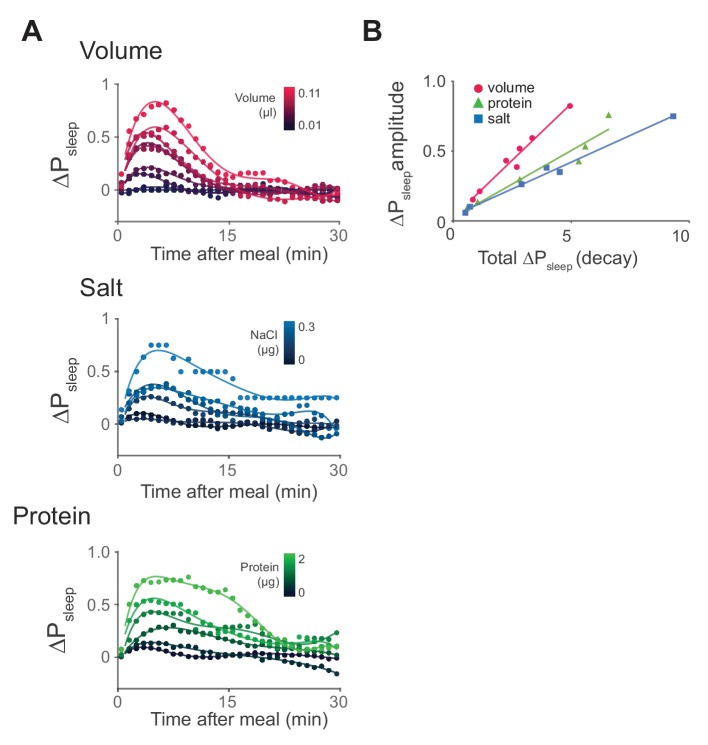
Figure 4—figure supplement 2. Time-course analysis of sleep in response to meal components reveals differential kinetics.

Figure 4—figure supplement 2.

(A) Time-course analysis of ΔPsleep for meals of graded volume, protein, or salt consumption (circles represent 1 min binned averages, lines represent spline fit). n = 811 meals, volume; 714, protein; 478, salt; 1131, sucrose. (B) ΔPsleep amplitude for gradings of volume, protein, and salt plotted against total ΔPsleep during the decay phase 20 min following the maximum.