Figure 2. GIV and S245-phosphorylated GIV localize to cell-cell junctions.
(A) MDCK cells were grown on glass cover slips, exposed or not to energetic stress (glucose deprivation for 30 and 120 min), and subsequently fixed and stained for total (t) GIV (red) and DAPI (blue; nuclei) and analyzed by confocal microscopy. Representative confocal images are shown. In domed monolayers at basal condition, GIV is absent from cell-cell junctions. However, GIV is detected at cell-cell junctions (arrowheads) after energetic stress induced by glucose deprivation. Scale bar = 10 μm. (B) MDCK cells were grown on glass cover slips, at various stages during their growth phase: from single-cells (top), to non-confluent monolayers (middle), to confluent domed monolayers (bottom). They were fixed and stained for Occludin (a TJ marker; green), pS245-GIV (red) and DAPI (blue; nuclei) and analyzed by confocal microscopy. Confluent monolayers were either maintained in complete medium in the presence of glucose (+ Glucose), or subjected to energetic stress by glucose deprivation (No Glucose) or calcium deprivation (EGTA). Representative fields are shown on the left. RGB plots, generated using ImageJ on the right assess the degree of colocalization between pS245-GIV and Occludin along the lines in the corresponding images during cell polarization are shown in the middle. Schematics summarizing the staining pattern in each condition are shown on the right. Scale bar = 25 μm.

Figure 2—figure supplement 1. Active AMPK localizes to specialized regions of the TJs called tricellular TJs exclusively after energetic stress.

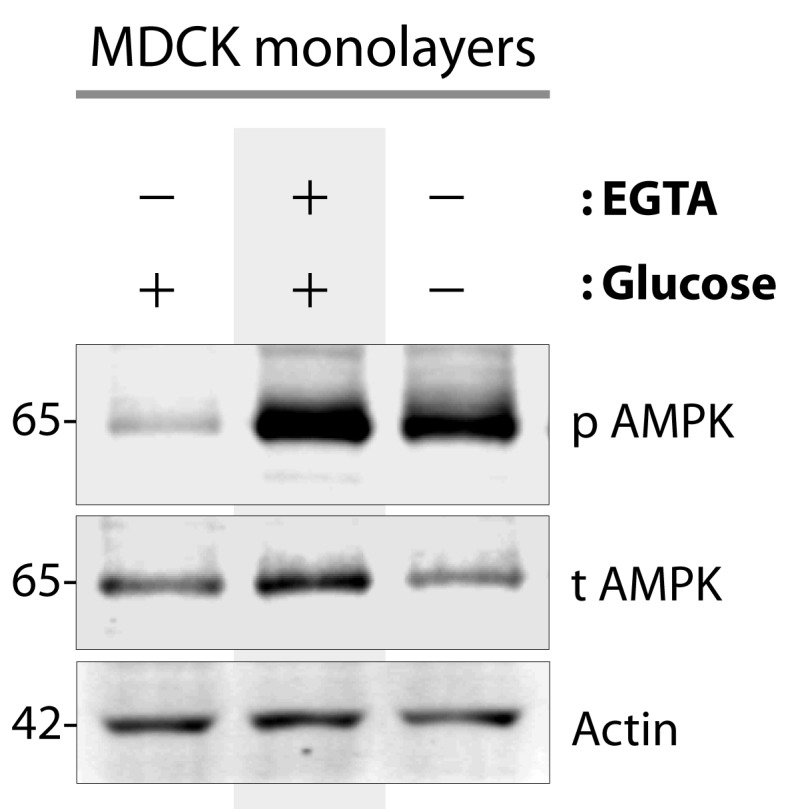
Figure 2—figure supplement 2. AMPK is activated when type II MDCK cells are exposed to energetic stress or low-calcium growth conditions.