. 2016 Nov 4;5:e20795. doi: 10.7554/eLife.20795

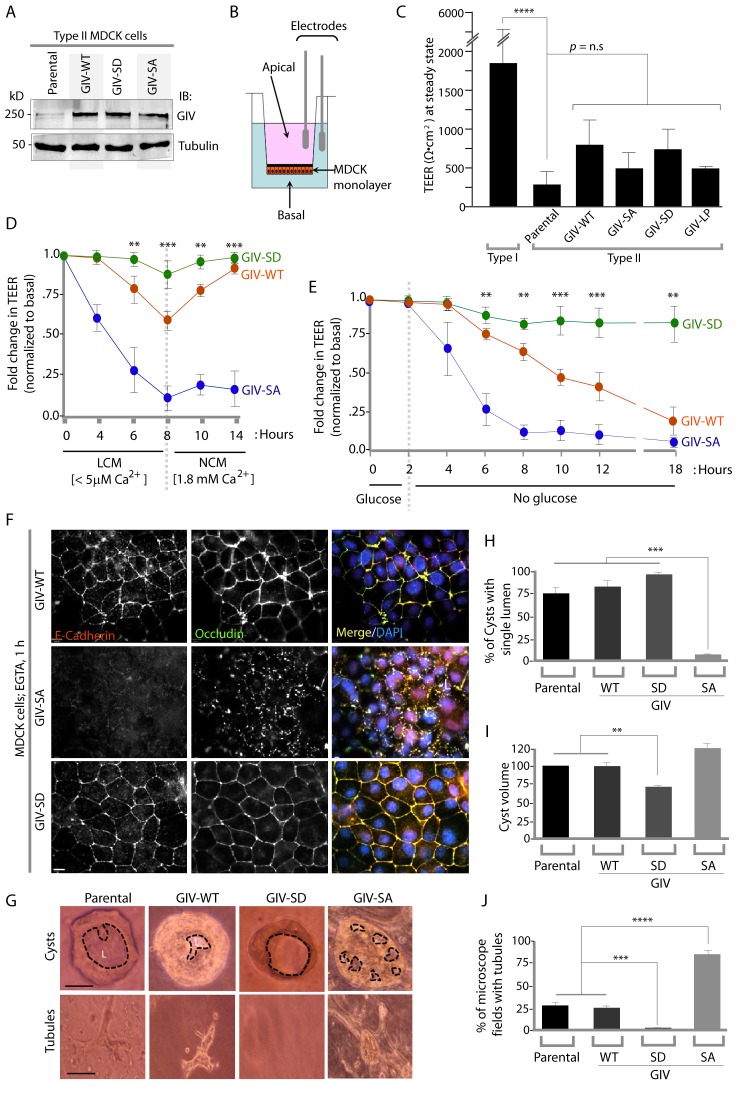
Figure 4. Phosphorylation of GIV at S245 stabilizes tight junctions (TJs) under low-calcium states and is essential for epithelial barrier function and morphogenesis.

(A) Whole cell lysates of MDCK cells stably expressing wild-type GIV (GIV-WT), or non-phosphorylatable (S→A; GIV-SA), or phospho-mimicking (S→D; GIV-SD) mutants of GIV were analyzed for GIV and tubulin by immunoblotting. (BC) Transepithelial electrical resistance (TEER) was measured using a Millicel-ERS resistance meter across fully polarized domed monolayers of various MDCK cell lines grown to domed confluency in Transwell inserts (schematic shown in B) in the presence of full growth media with normal calcium. Bar graphs (C) display the TEER measured across each cell line. As expected, type I MDCKs exhibit higher TEER than type II cells. No significant differences were noted between the MDCK-GIV cell lines stably expressing the various GIV constructs. n = 3. Results are expressed as ± SEM. ****p<0.0001. (DE) Changes in TEER was measured across monolayers of various MDCK cell lines during exposure to low-calcium media (LCM; left), followed by switching to normal calcium media (NCM; right) or during energetic stress when exposed to media without glucose. Graphs in D and E show that compared to MDCK-GIV-WT cells, TEER rapidly dropped across MDCK-GIV-SA monolayers exposed to LCM (D) as well as energetic stress (E) but relatively preserved in MDCK-GIV-SD cells. This drop is rapidly and completely reversed upon exposure to NCM in MDCK-GIV-WT and SD cells, but remains impaired in MDCK-GIV-SA cells. n = 3. Results are expressed as ± SEM. **p<0.01; ***p<0.001; **p<0.01. (F) MDCK-GIV cell lines were grown to full confluency into domed monolayers, treated with EGTA for 1 hr, and subsequently fixed. Fixed cells were stained for E-cadherin, Occludin, and DAPI (nuclei; blue), and analyzed by confocal microscopy. Images displayed are representative of 13–15 HPF images captured at 60X mag in each cell line. Preservation of TJs and AJs, as visualized using Occludin and E-Cadherin as markers, was significantly higher in MDCK-GIV-WT and MDCK-GIV-SD [65–90% of the imaged surface area; n = 15 randomly imaged fields in each cell line], but not in MDCK-GIV-SA cell lines [0–4% of the imaged surface area; n = 13 randomly imaged fields; p<0.001]. Scale bar = 10 μm. See also Figure 4—figure supplements 2 and 3 for the findings at baseline and at 4 hr time point. (G) Parental MDCK cells and various MDCK-GIV cell lines were seeded and grown in collagen-containing matrix for 2 weeks and analyzed for the formation of cyst and tubular structures by light microscopy. Representative cysts and tubular structures are shown for each cell line. L = lumen. Scale bar = 50 μm. (HJ) Bar graphs display the % of cysts with single lumens (Y axis; H), cyst volume (Y axis; I) and % fields with tubule formations (Y axis; J) seen in each cell line in G. Absolute numbers for cyst volume were normalized to parental cells (set to 100%). Three independent experiments comprising 450–600 cysts per cell line are summarized. Results are expressed as ± SEM. **p<0.01; ***p<0.001; ****p<0.0001.

DOI: http://dx.doi.org/10.7554/eLife.20795.007

Figure 4.

Figure 4—figure supplement 1. A comparison of levels of GIV expression in Type I vs Type II MDCK cells.
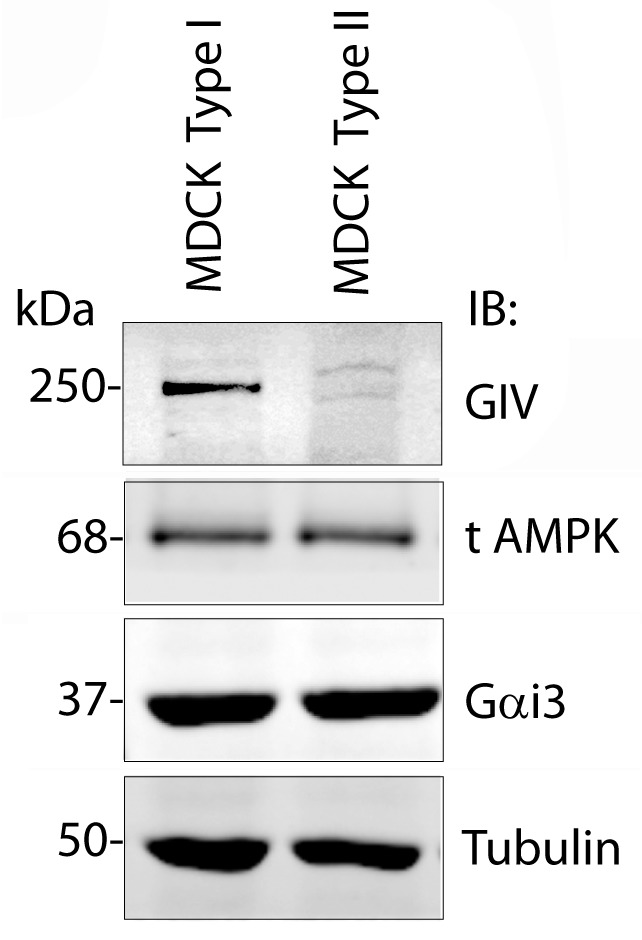
Figure 4—figure supplement 1.

Whole-cell lysates of MDCK cells type I and type II were grown to domed confluence on culture dishes in the presence of normal calcium media (NCM), lysed, and analyzed for GIV, AMPK, Gαi3 and tubulin by immunoblotting (IB). While GIV is detected in both Type I and II MDCK subclones, its level of expression is significantly lower in MDCK Type II cells. Levels of expression of AMPK, Gαi3, and tubulin are equal in both Type I and II cell lines.
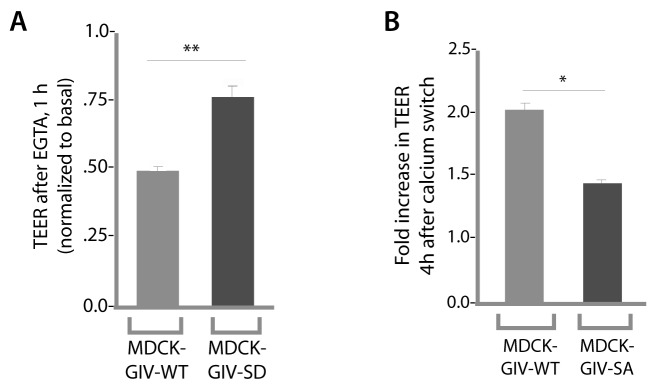
Figure 4—figure supplement 2. Phosphorylation of GIV at S245 is required for maintenance of TEER in the absence of calcium in growth media, as well as for recovery of TEER after calcium switch.

Figure 4—figure supplement 2.

Drop in TEER in the presence of the Ca2+ chelator EGTA (E) and recovery of TEER during Ca2+ switch (after EGTA washout) were measured in MDCK-GIV cell lines as in Figure 4B–D. Bar graphs in E show that compared to controls (MDCK-GIV-WT), MDCK-GIV-SD showed less drop in TEER compared to basal (i.e. more resistance to EGTA). Bar graphs in F show that compared to controls (MDCK-GIV-WT), MDCK-GIV-SA showed impaired recovery of TEER compared to basal (i.e. less responsive to Ca2+ switch). **p<0.01. *p<0.05.
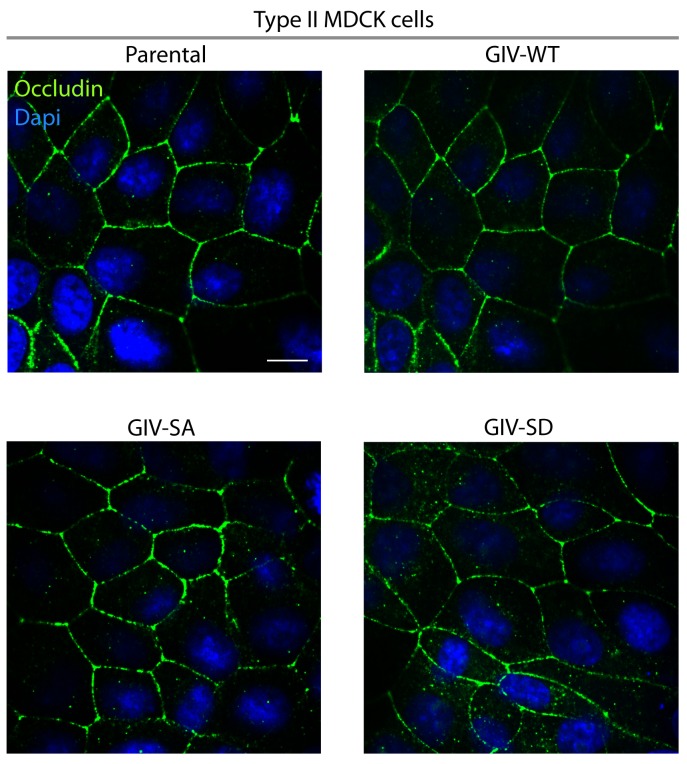
Figure 4—figure supplement 3. A comparison of tight junction morphology in parental and the various Type II MDCK-GIV cell lines.

Figure 4—figure supplement 3.

Parental and MDCK-GIV cell lines were grown to fully polarized domed confluence on culture dishes in the presence of normal calcium and glucose, fixed, and stained for occludin (a TJ marker) and analyzed by confocal microscopy. No discernible differences were noted in the intensity or pattern of staining with Occludin. These findings are consistent with the similar TEER values measured across these monolayers (Figure 4C), indicating that all these cells make similar functional tight junctions. Scale bar = 20 μm.
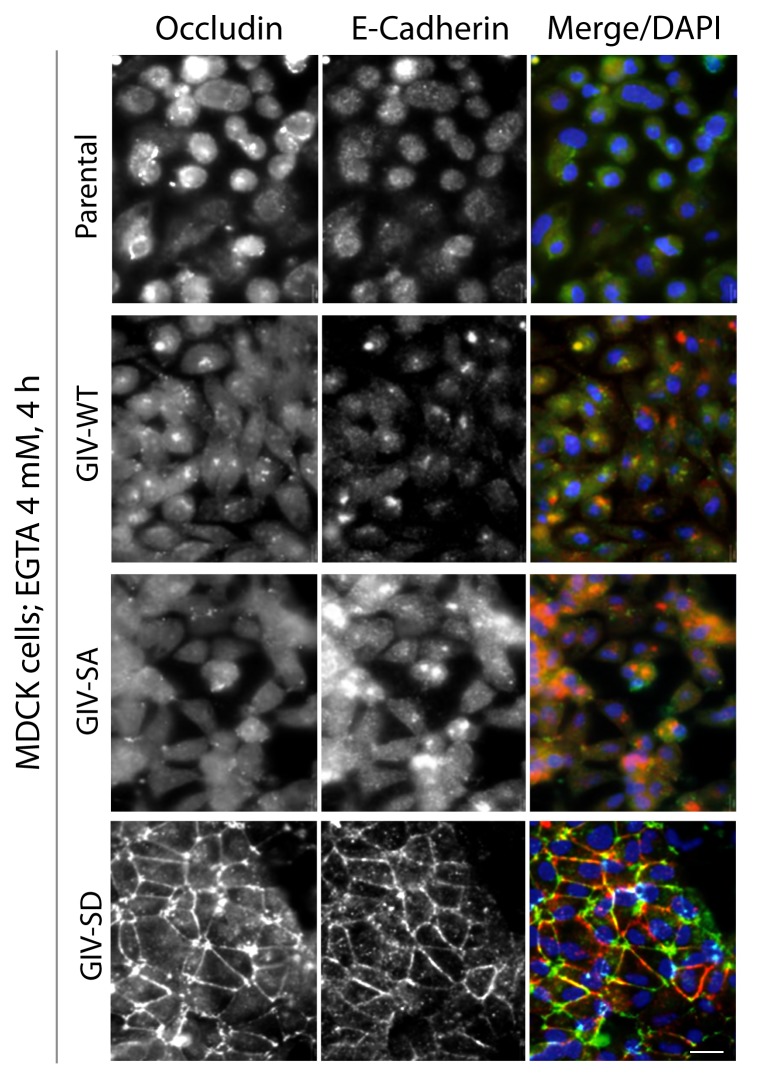
Figure 4—figure supplement 4. Phosphorylation of GIV at S245 stabilizes tight junctions (TJs) under low-calcium states.

Figure 4—figure supplement 4.

MDCK cell lines stably expressing various GIV constructs were grown to full confluency into domed monolayers prior to treating them with EGTA for 4 hr prior to fixation. Fixed cells were stained for E-cadherin, occludin, and DAPI (nuclei; blue), and analyzed by confocal microscopy. Both TJs and AJs, as visualized using occludin and E-Cadherin as markers, were preserved in MDCK-GIV-SD, but not in MDCK-GIV-WT or SA cell lines. See also Figure 4F for the findings at 1 hr.
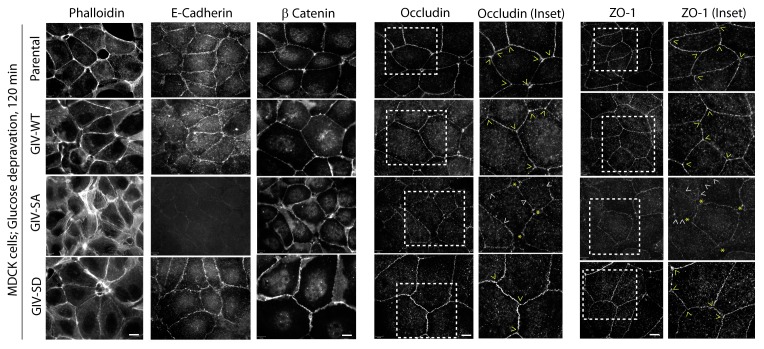
Figure 4—figure supplement 5. Phosphorylation of GIV at S245 stabilizes tight junctions (TJs) in cells exposed to energetic stress.

Figure 4—figure supplement 5.

Parental MDCK cells and MDCK cell lines stably expressing various GIV constructs were grown to full confluency into domed monolayers prior to subjecting them to energetic stress by expositing them to glucose-free media (glucose deprivation) for 120 min prior to fixation. Fixed cells were stained for various markers of TJs (Occludin, ZO-1) and AJs (β-catenin, E-cadherin), Actin (Phalloidin) and DAPI (nuclei; blue), and analyzed by confocal microscopy. MDCK-GIV-SA cells, but not parental MDCK cells, or MDCK-GIV-WT or SD cells showed increased actin stress fibers (visualized by Phalloidin staining), loss of E-cadherin from cell-cell junctions, interruptions in occludin and ZO-1 staining along cell-cell contact sites (arrowheads) and gaps between cells (yellow starts).