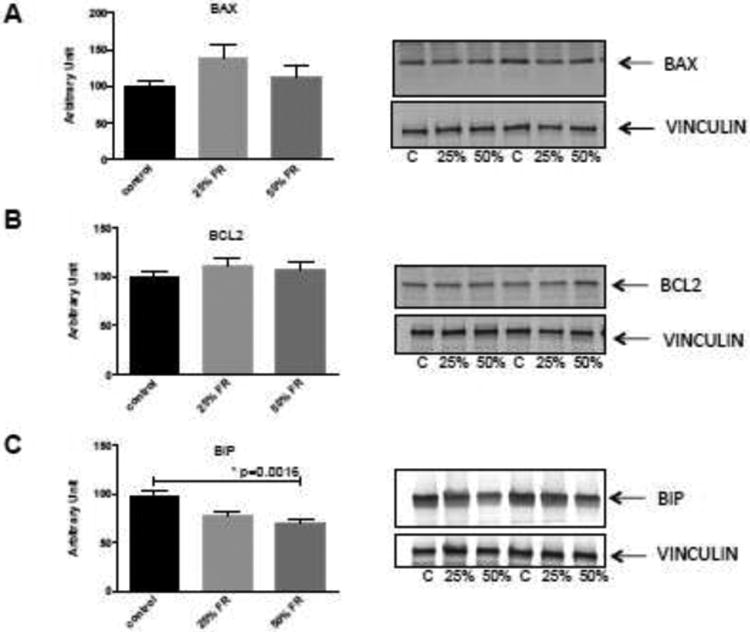
Figure 3. Western immunoblotting of apoptosis and ER stress markers in the placentas of gestational FR-exposed mice.

Representative blots of BAX (A), BCL2 (B) proteins as markers of apoptosis, and BIP (C) as a marker of ER stress are shown. There were no significant differences between groups for BAX and BCL2 expression. BIP expression however, was decreased in both the 25% and 50% FR groups, compared to controls. Data are represented in graphs as means ± SEM. Asterisk indicates p<0.05 by ANOVA. C=control, 25%=25% FR group, 50%=50% FR group (n=9/group).
