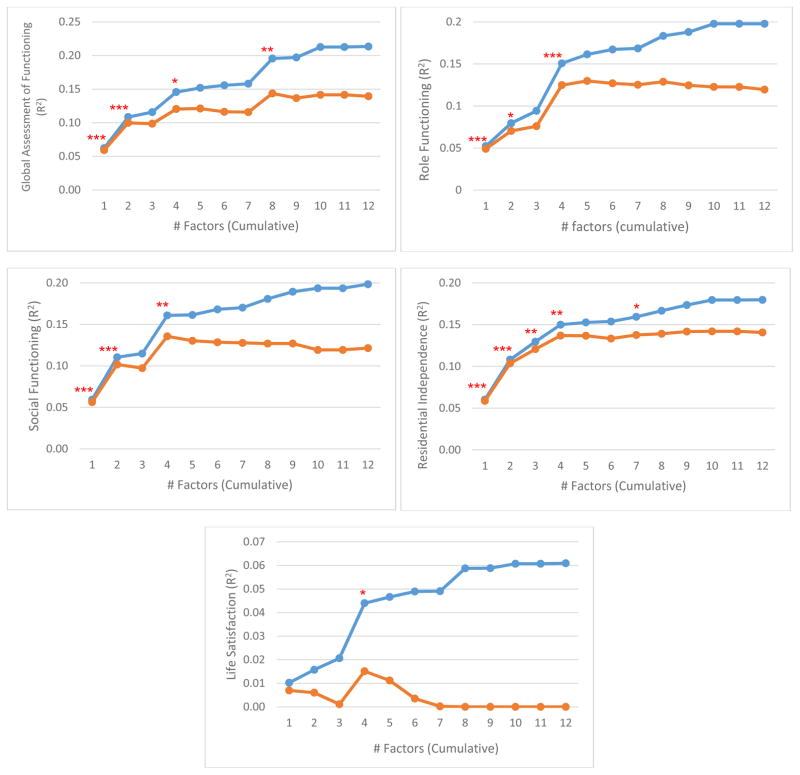
Figure 3.
Prediction of 20-year outcomes from baseline symptom dimensions. Blue curves show cumulative predictive power (R2) for a given factor structure plus all simpler structures. Orange curves show the same but present adjusted R2, which controls for increase in fit due to chance, resulting from the greater number of predictors in the model. Asterisks indicate significant ΔR2 for that structure vs. all simpler structures combined (*p < .05, **p < .01, ***p < .001).

