Figure 3.
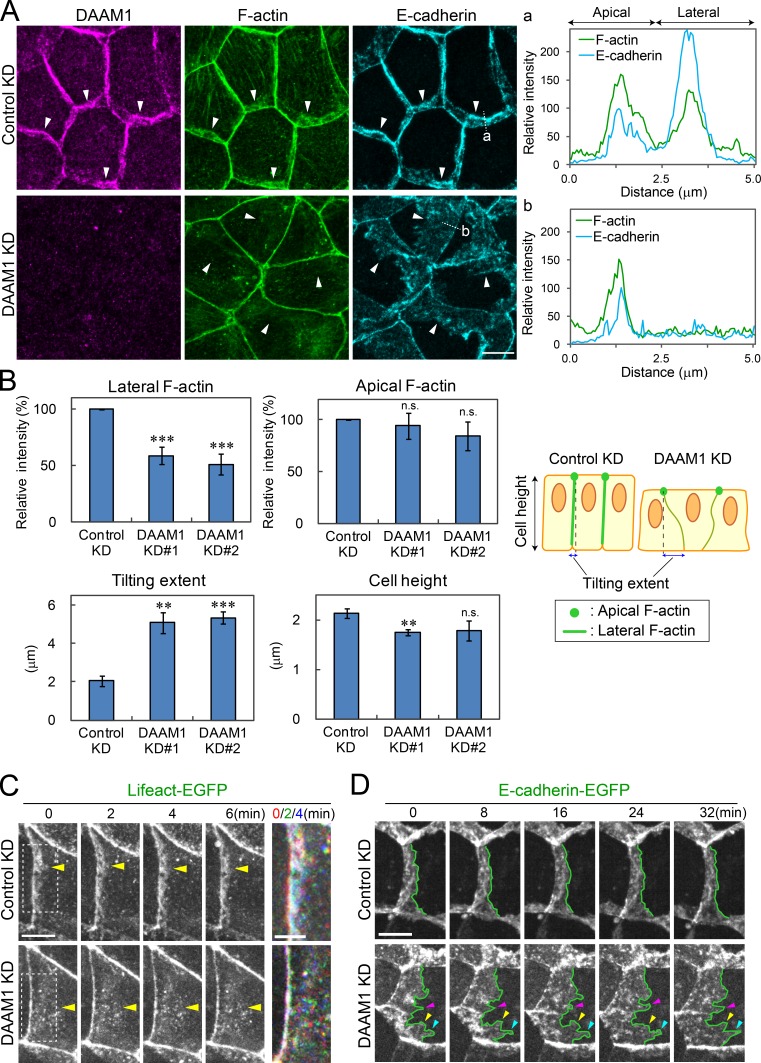
DAAM1 depletion causes dispersion of lateral F-actin and E-cadherin, not affecting their apical moieties. (A) EpH4 cells were transfected with DAAM1 siRNA (DAAM1 KD) or control siRNA (Control KD) for 3 d and co-stained for E-cadherin and F-actin. DAAM1 depletion caused dispersion of F-actin and E-cadherin at LCs without affecting their apical distribution. Densitometric traces were performed along the dotted lines (a and b) in an apical to basal direction. Arrowheads point to the basal edges of the junctions. (B) Quantification of apical and lateral F-actin intensity (top), as well as tilting extent of LCs and cell height (bottom), which are defined in the diagram at the right and also in Materials and methods. Histograms represent the mean of three experiments. In each experiment, 50–100 junctions were examined. Two independent DAAM1 siRNAs (KD#1 and #2) were used. Error bars indicate SD. **, P < 0.01; ***, P < 0.001; n.s., not significant. (C) Still images of Videos 1 and 2 taken for Lifeact-EGFP at the indicated intervals. On the right, the images at 0, 2, and 4 min are merged after coloring Lifeact-EGFP signals red, green, and blue, respectively. The boxed portion is enlarged for the merged images. Note that the majority of F-actin clusters change their positions every 2 min, especially in DAAM1-depleted cells. Yellow arrowheads point to the basal edges of the junctions. (D) Still images of Videos 3 and 4 taken for E-cadherin–EGFP at the indicated intervals. Note that the basal edges, outlined in green, move more dynamically in DAAM1-depleted cells than in controls. Blue, yellow, and pink arrowheads indicate the basal edge of the junction at different points. Bars: (A, C [left], and D) 10 µm; (C, right) 5 µm.

