Figure 1.
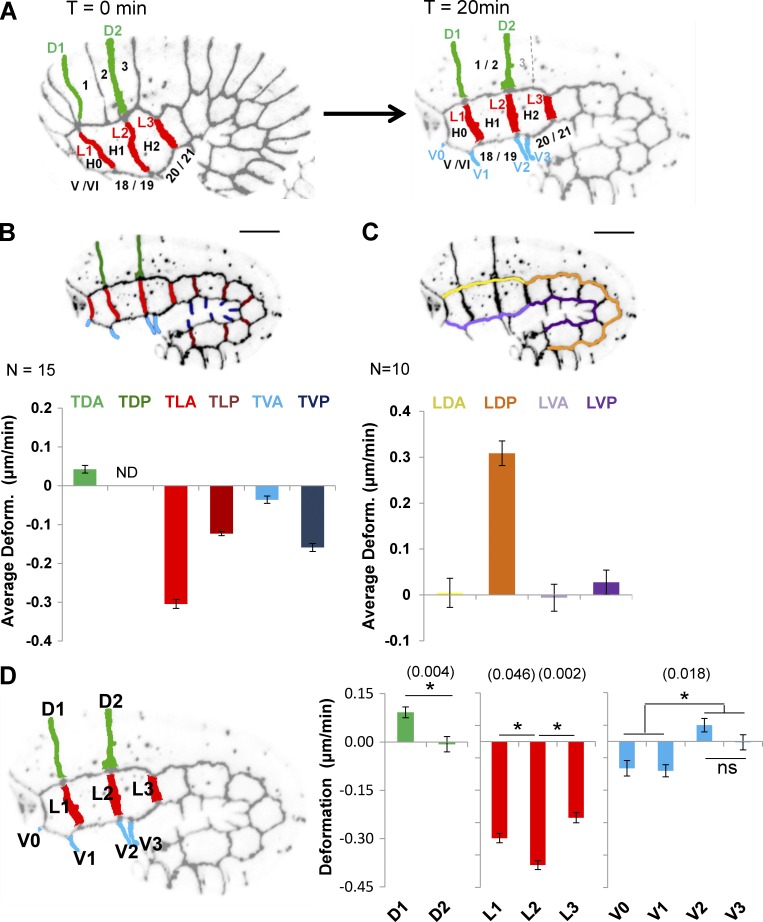
Hypodermal cells follow different morphogenetic programs during early elongation. (A) Identification of anterior dorsal (green), lateral (red), and ventral (blue) hypodermal cells and their cell–cell junctions. Bar graph representing the AD (in micrometers per minute) of groups of transversal (B) and longitudinal (C) junctions identified in embryos expressing AJM-1::GFP and VAB-10(ABD)::mCherry. The junctions are indicated by color coding: transversal junction between dorsal posterior cells (TDP), dark green; TDA, light green; TLA, light red; TLP, dark red; TVA, light blue; and TVP, dark blue; longitudinal junctions between dorsal anterior cells (LDA), yellow; dorsal posterior cells (LDP), orange; ventral anterior cells (LVA), light purple; and ventral posterior cells (LVP), dark purple. Positive AD values indicate that junctions elongate; negative values, that they shrink. N ≥ 10 embryos were analyzed for each junction. (D) Bar graphs representing deformation of individual transversal anterior junctions in micrometers per minute. ND, not determined; ns, not significant; p-values (*) for significant t test are indicated in parentheses. Error bars indicate SEM.

