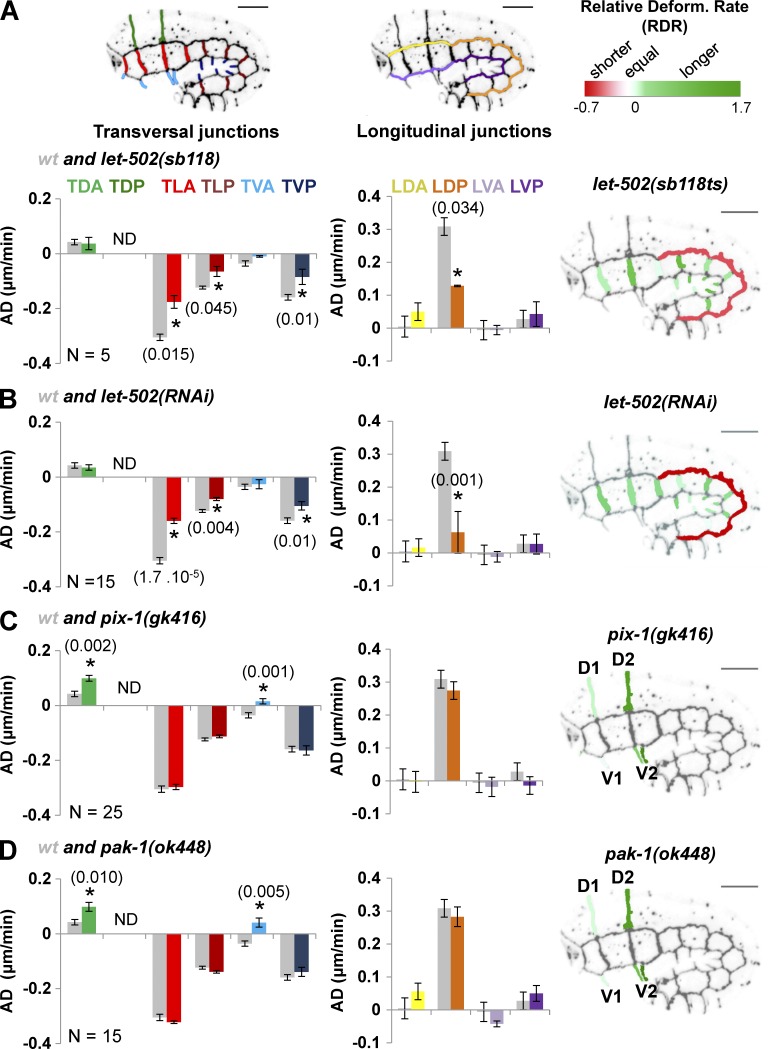
Figure 2.
let-502and pix-1/pak-1 control the morphogenesis of different sets of hypodermal cells. Bar graphs representing the AD (in micrometers per minute) of cell–cell junctions in let-502(sb118ts) (A), let-502(RNAi) (B), pix-1(gk416) (C), and pak-1(ok448) (D) embryos expressing AJM-1::GFP and VAB-10(ABD)::mCherry. Gray bar graphs in A–D represent AD measured for groups of junctions in wt embryos. The junctions are indicated in the embryo and bar graphs by color coding: transversal junction between dorsal posterior cells (TDP), dark green; TDA, light green; TLA, light red; TLP, dark red; TVA, light blue; and TVP, dark blue; longitudinal junctions between dorsal anterior cells (LDA), yellow; dorsal posterior cells (LDP), orange; ventral anterior cells (LVA), light purple; and ventral posterior cells (LVP), dark purple. Positive AD values indicate that junctions elongate; negative values, that they shrink. N > 5 embryos were analyzed per genotype and junction. Right, RDRs for mutants versus wt. ND, not determined; p-values from significant t test (*) are indicated in parentheses. Error bars indicate SEM.

