Figure 3.
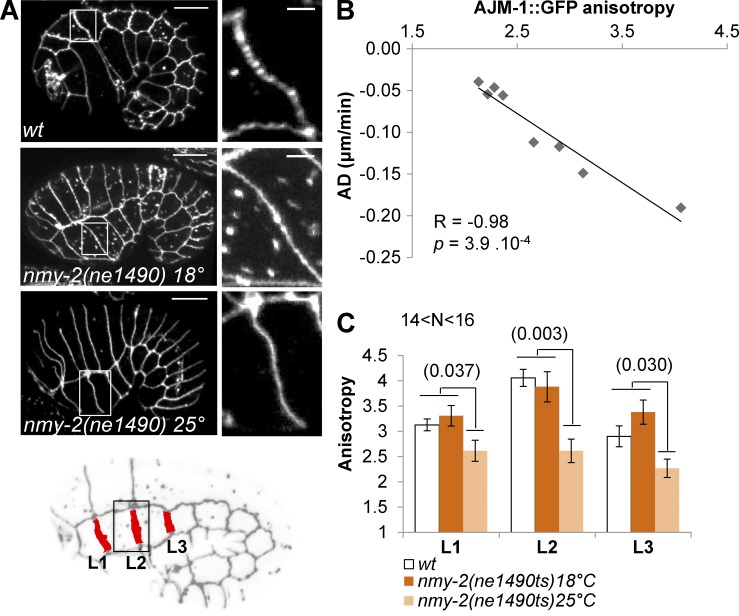
AJM-1::GFP anisotropy is indicative of the level of myosin-dependent cell–cell junction remodeling. (A) z-projections of confocal images of AJM-1::GFP expressed in wt and nmy-2(ne1490ts) at 18°C or 25°C. Locations of the enlarged image (right) are indicated by a white box. Bar: 10 µm; (enlarged image) 2 µm. L1–3 transversal lateral anterior junctions are identified in the embryo (B). Scatter plot expressing the AD of transversal junctions between lateral cells with respect to the mean AJM-1::GFP anisotropy measured for corresponding junctions. The Spearman correlation test (R) and corresponding p-value are indicated. (C) AJM-1::GFP anisotropy at lateral L1, L2, and L3 junctions of ajm-1::GFP; vab-10(ABD)::mCh (wt) and nmy-2(ne1490ts); ajm-1::GFP embryos at 18°C and 25°C. Significant t test p-values are indicated in parentheses. Error bars indicate SEM. N > 14 embryos were analyzed per genotype and junction.

