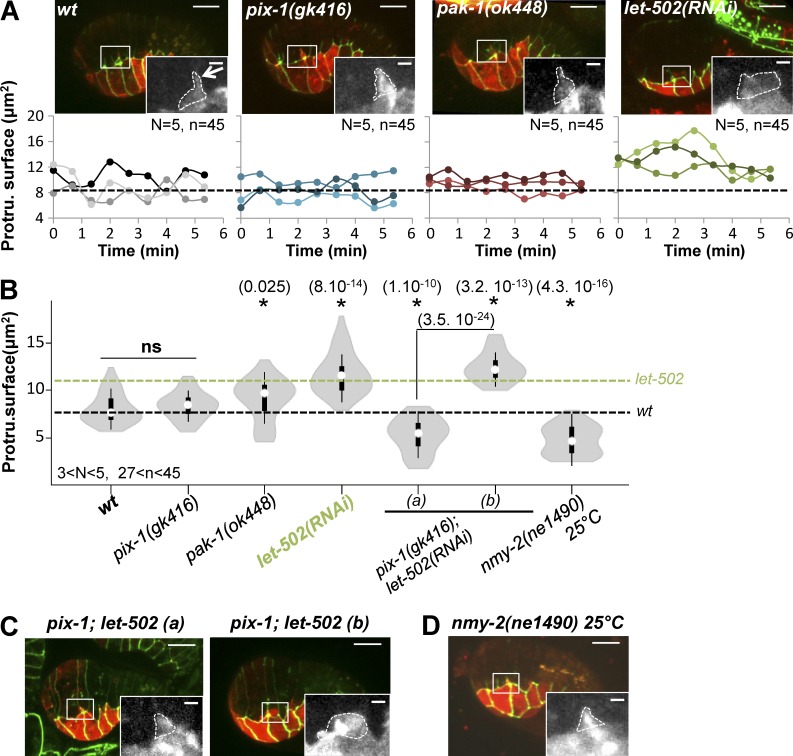
Figure 7.
let-502 controls the formation of protrusions by lateral anterior cells. (A) z-projections of confocal images and protrusion surface over time (bottom) are indicated for three representative wt, pix-1(gk416), pak-1(ok448), and let-502(RNAi) embryos expressing AJM-1::GFP (green; top) and VAB-10(ABD)::mCherry (red; top). The dashed lines correspond to the mean spreading rates for wt (black; A and B) and let-502(RNAi) (green; B). (B) Violin plot representing the distribution and mean of the protrusion surfaces for N analyzed embryos and n analyzed protrusions. z-projections of confocal images of populations (a) and pix-1(gk416); let-502(RNAi) embryos (b). N > 3 embryos were analyzed per genotype and junction (C) of nmy-2(ne1490)ts animals at 25°C (D). Significant t test vs. wt; p-values (*) are indicated in parentheses. ns, not significant. Bars: 10 µm; (enlarged images) 2 µm.

