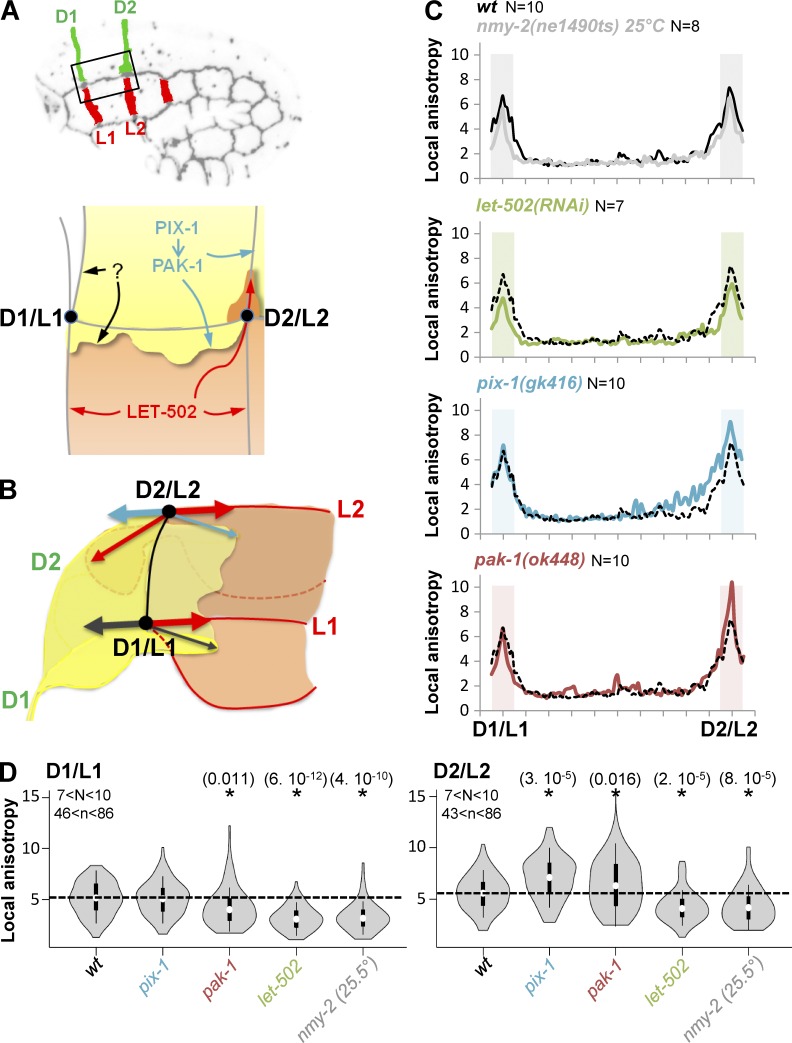
Figure 8.
AJM-1::GFP local anisotropy at D2/L2 vertex is increased in pix-1 and pak-1 mutants. (A and B) Schematic representation of lateral and dorsal anterior cells, identifying cell–cell junctions as well as the function shown for let-502, pix-1, and pak-1 on apical junction remodeling and formation of basolateral protrusions. D1/L1 and D2/L2 vertices are also indicated. Arrows represent direction of forces produced by machineries remodeling apical junction and basolateral protrusions. (C) Local anisotropy of AJM::GFP along the longitudinal junction between D1/L1 and D2/L2 vertices in wt (black line), nmy-2(ne1490ts) at restrictive temperature 25°C, let-502(RNAi), pix-1(gk416), and pak-1(ok448). Areas of the junctions submitted to Student’s t test for mutants vs. wt are shaded. N > 7 embryos were analyzed per genotype and junction. (D) Violin plot representing the distribution and mean local anisotropy of AJM-1::GFP for N analyzed embryos and n analyzed junctions. *, Significant t test vs. wt. P-values are indicated in parentheses.

