Figure 1.
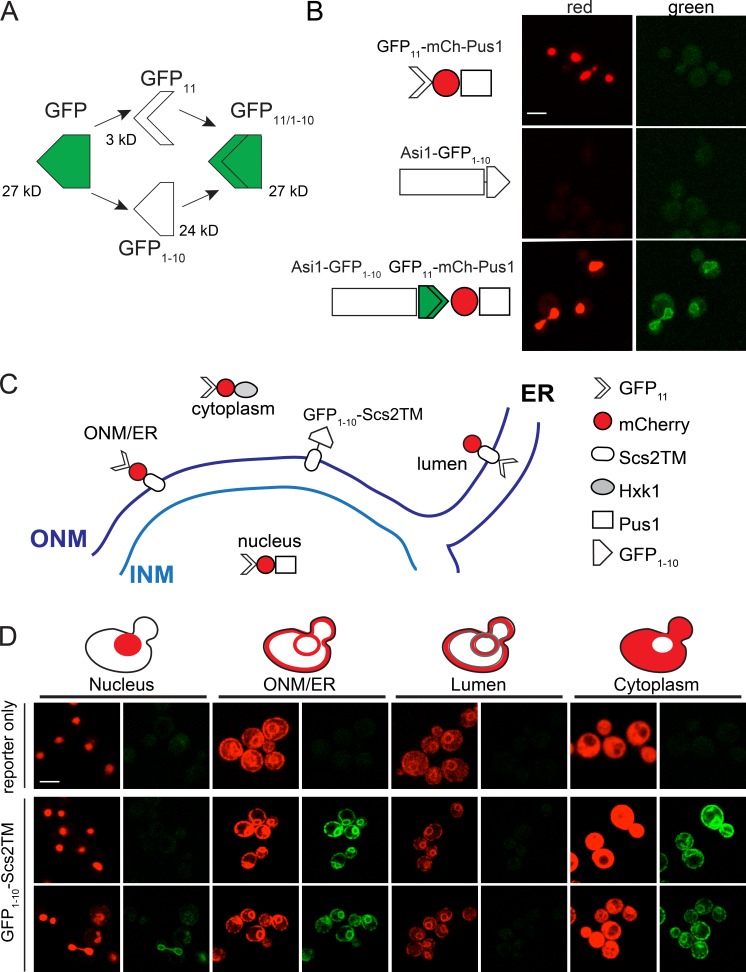
Split-GFP to study protein localization. (A) Schematic of the GFP complementation system. Protein molecular masses in kilodaltons based on amino acid composition. (B) Schematics show the GFP11-mCherry-Pus1 reporter and INM protein Asi1-GFP1–10, which were expressed alone (top and middle) or together in yeast. Fluorescence in the red (561-nm) and green (488-nm) channels is shown. Residual background is autofluorescence, which was shown by multispectral imaging (not depicted). (C) Schematic illustrating the localization of GFP11-mCherry reporters to detect signal inside the nucleus (GFP11-mCherry-Pus1), ONM/ER surface (GFP11-mCherry-Scs2TM), ER lumen (mCherry-Scs2TM-GFP11), and cytoplasm (GFP11-mCherry-Hxk1). An ONM/ER protein containing the Scs2 transmembrane domain fused to GFP1–10 on its cytoplasmic side is also shown. (D) Example images of reporters alone (top) or with GFP1–10-Scs2TM (bottom). Bars, 2 µm.

