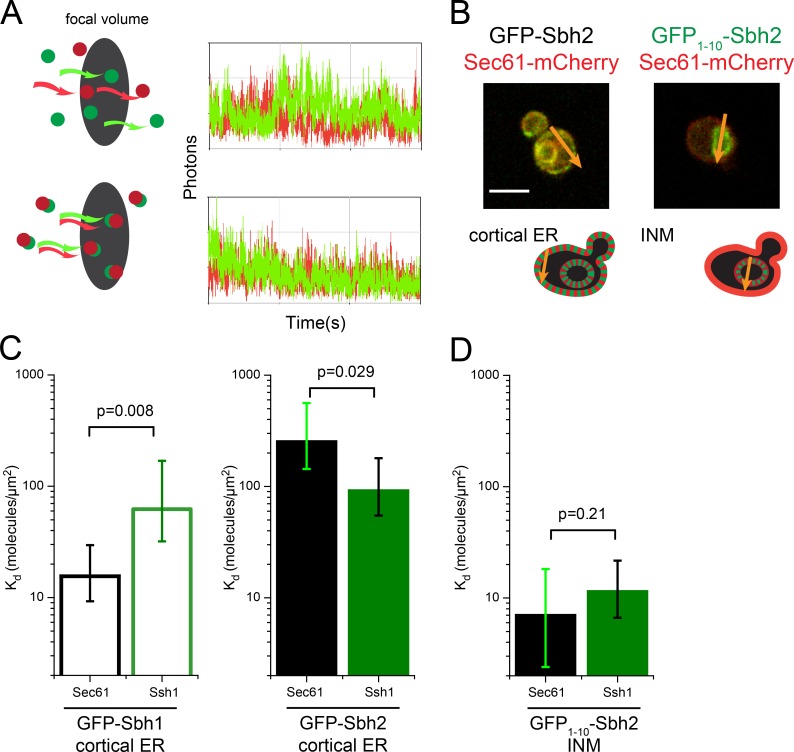
Figure 9.
FCCS with split-GFP reveals novel INM complex. (A) Principle of FCCS is illustrated for randomly diffusing red and green particles (top) and codiffusing particles (bottom) using simulated data. (B) Focal volumes defined by arrows to include the cortical ER for Sbh2-GFP or INM for GFP1–10-Sbh2/GFP11-Pus1 (green) in strains containing Sec61-mCherry (red) show how FCCS data were acquired at specific regions within the cell. Bar, 2 µm. (C) Kd for Sbh1 and Sbh2 with Sec61 (n = 21, Sbh1; n = 23, Sbh2) and Ssh1 (n = 37, Sbh1; n = 27, Sbh2) at the cortical ER was determined by cross-correlation analysis as described in Materials and Methods from FCCS data. (D) Kd for Sbh2 with Sec61 (n = 45) and Ssh1 (n = 24) at the INM. Because Sbh1 did not localize to INM, no FCCS at this location could be acquired. Error bars in C and D indicate SEM. P-values were calculated by Monte Carlo simulation.

