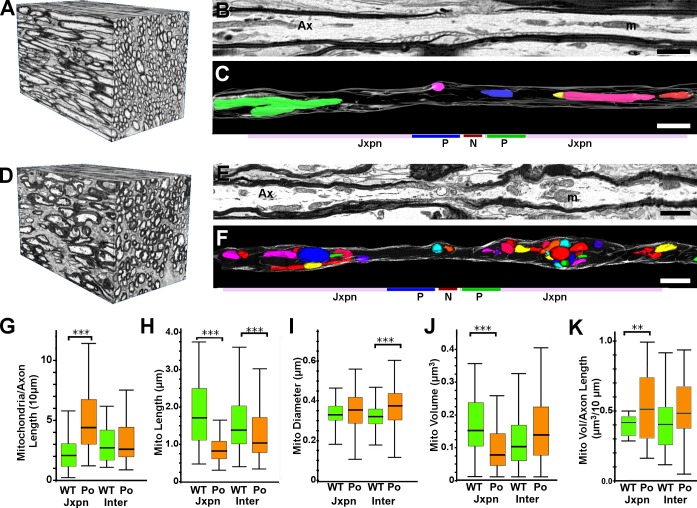
Figure 1.
Mitochondria in 1-mo-old WT and P0-CNS optic nerve axons. (A–F) 3D EM reconstructions of 1-mo-old WT (A–C) and P0-CNS (D–F) optic nerve segments showing 3D organization of fibers (A and D), a single-slice view of a myelinated axon (B and E), and 3D reconstructions of mitochondria in single axons (C and F; individual mitochondria are shown as different colors). Bars, 1 µm. m, mitochondria. (G) Mitochondrial numbers were increased in P0-CNS juxtaparanodal axoplasm and were similar in WT and P0-CNS internodal axoplasm. (H and I) Compared with mitochondria in WT axons, individual mitochondria in P0-CNS axons were significantly shorter (H) and slightly thicker (I). (J) The volumes of individual mitochondria were decreased in P0-CNS juxtaparanodal axoplasm and internodal axoplasm. (K) Total mitochondrial volumes were increased in P0-CNS juxtaparanodal axoplasm and were similar in WT and P0-CNS internodal cytoplasm. Jxpn, juxtaparanodal; Ax, axon; P, paranode; N, node. (G–K) Bar, median; box, 25–75%; whiskers show range; **, P < 0.01; ***, P < 0.001; WT versus P0-CNS, Wilcoxon signed-rank test with Bonferroni’s correction for multiple comparisons. Data were pooled for mitochondria (H–J, n = 44, 115, 210, and 198) and axons (G and K, n = 19, 22, 37, and 40) from three animals for analysis.

