
Figure 4.
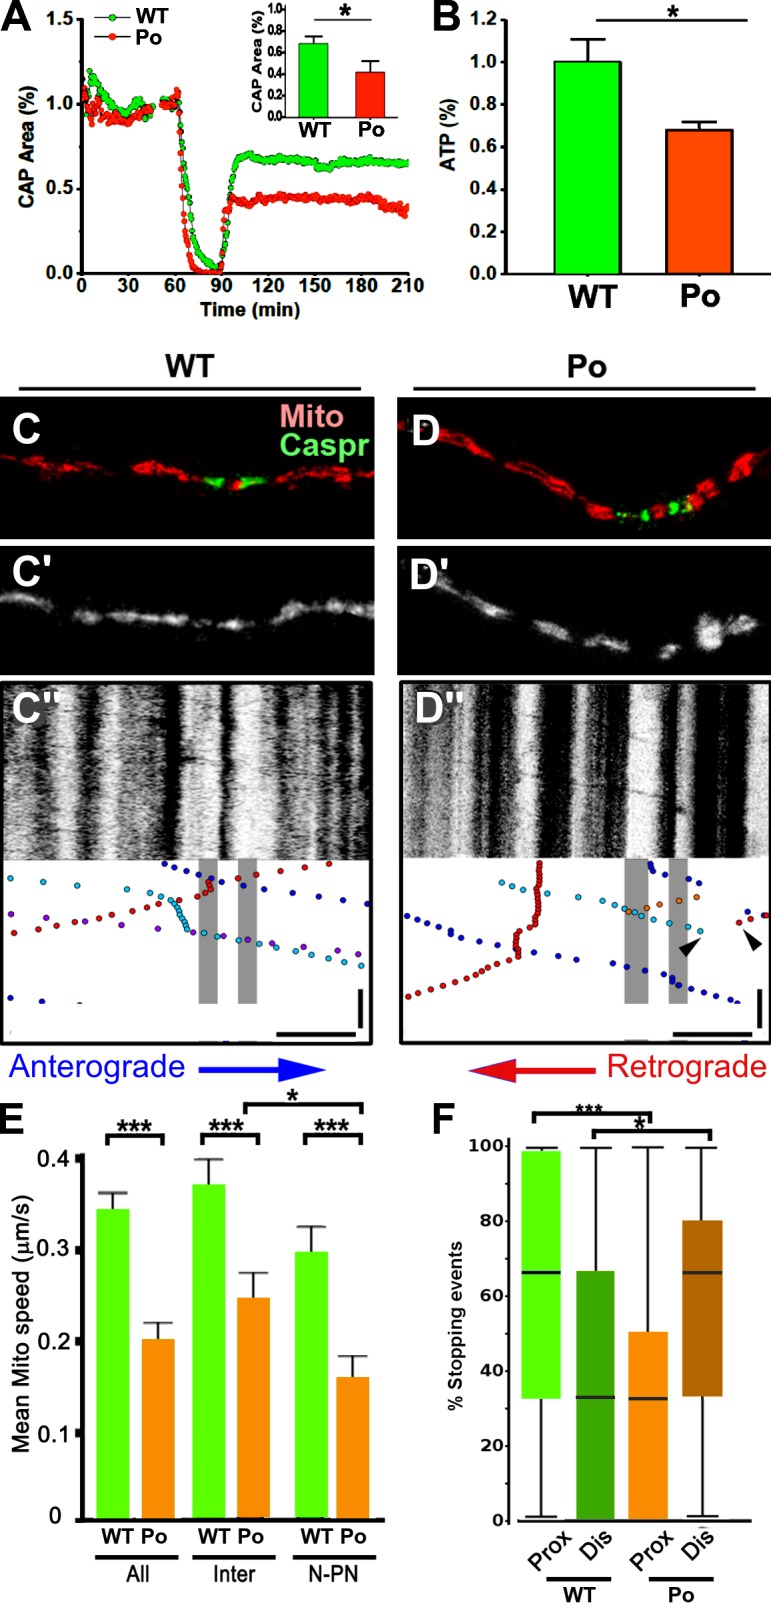
Increased vulnerability to energy deprivation and altered mitochondrial transport in optic nerves from P0-CNS mice. (A) Recordings of CAPs in 1-mo-old P0-CNS mice (orange circles, n = 4) showed a rapid loss of CAPs and reduced recovery after 30 min of OGD compared with age-matched controls (green circles, n = 6). The inset bar graph summarizes recovery at the end of 2 h after OGD exposure. *, P = 0.026. (B) ATP levels were reduced in optic nerves from 1-mo-old P0-CNS mice compared with controls. ATP levels were corrected to protein and normalized to WT controls. *, P = 0.015. (C–F) In organotypic slice cultures, mitochondrial transport was altered in myelinated P0-CNS axons. (C and D) Node locations were identified after time-lapse imaging by immunostaining for Caspr (green) and registered to axonal Mito-Dendra2 labeling (red). Live time-lapse images of mitochondria (C′ and D′) are converted to kymographs (C″ and D″), where cessation of mitochondrial transport is frequently observed in P0-CNS axons (P0; D″, arrowheads). Bars: (horizontal) 10 µm; (vertical on kymograph) 100 s. (E) The mean speed of motile mitochondria was significantly reduced in P0-CNS axons compared with WT axons over the entire axon segment studied (All) and within internodal (Inter) and nodal–paranodal axoplasm (N-PN). The mean mitochondrial speed in P0-CNS axons was significantly reduced in nodal–paranodal axoplasm compared with internodal axoplasm. Bars and lines are mean + SEM. n = 27, 28, 23, 27, 22, and 24. (F) Mitochondrial stopping events were quantified in proximal (Prox) and distal (Dis) regions of the nodes. Stopping events were more common in the proximal juxtaparanode in WT axons and in the distal juxtaparanodal axoplasm in P0-CNS axons. Bars with boxes and lines are median, interquartile range, and maximum/minimum. *, P < 0.05; ***, P < 0.001; t test; n = 32 and 23 (F) axons from three WT and three P0-CNS explants.