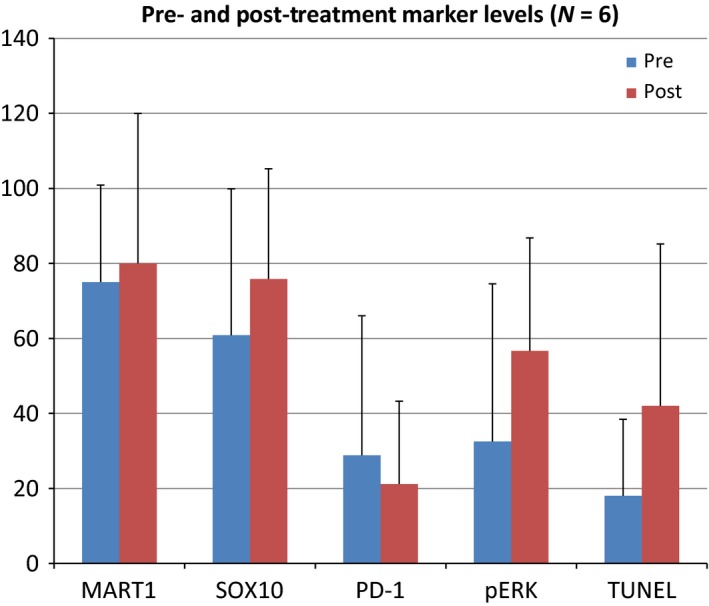
Figure 3.

Pre‐ and Posttreatment marker levels (N = 6). Patient's tumors were stained by IHC pre‐ and posttreatment with panobinostat. None of the changes pre‐ and posttreatment were statistically significant. P ‐value between time points for each marker MART‐1 P = 0.80, SOX10 P = 0.50, PD‐1 0.39, pERK P = 0.16, TUNEL P = 0.23. pERK, phosphorylated ERK.
