Figure 3.

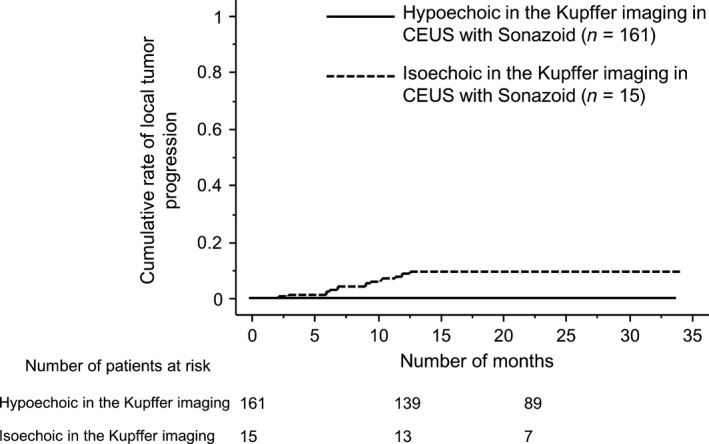
Kaplan–Meier plots for local tumor progression after successful RFA, according to an echoic pattern in the Kupffer phase in CEUS before treatment.

Kaplan–Meier plots for local tumor progression after successful RFA, according to an echoic pattern in the Kupffer phase in CEUS before treatment.