
Figure 3.
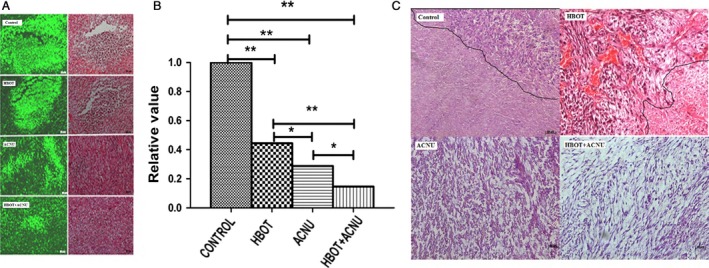
Observation of host cell infiltration (green) in necrotic tumor tissue and H&E‐stained transplanted tumors. (A) Host cell infiltration (green) in necrotic tumor tissue under a microscope. One H&E‐stained tissue section under fluorescent light and white light of a fluorescent microscope. The numbers of infiltrating cells with green fluorescence were different between the groups due to various sizes of necrotic areas; (B) for host cell infiltration (green) in necrotic tumor tissue, the relative ratios of the total intensity of green fluorescence in the control group to those in the other groups measured by Image‐Pro Plus 6.0 software. (C) H&E‐stained transplanted tumors under an optical microscope. The control group: necrotic areas with unclear tissue structure on the bottom left of the figure and non‐necrotic areas on the upper right, with a compact oncocytes arrangement, deeply stained nucleus, and distinct morphological changes. The hyperbaric oxygen therapy (HBOT) group: necrotic areas with unclear tissue structure on the bottom right of the figure and non‐necrotic areas on the upper left, with a compact oncocytes arrangement, deeply stained nucleus, distinct morphological changes, and many blood vessels. It was hard to determine necrotic areas in the nimustine (ACNU) group and the HBOT+ACNU group under an optical microscope. The cell arrangement of non‐necrotic areas was looser in the ACNU group than in the HBOT+ACNU group. The scale bar: 20×. The mice were divided into the four groups randomly, and each group had five mice, as shown in the Material and Methods section. *P < 0.05; **P < 0.01