
Figure 5.
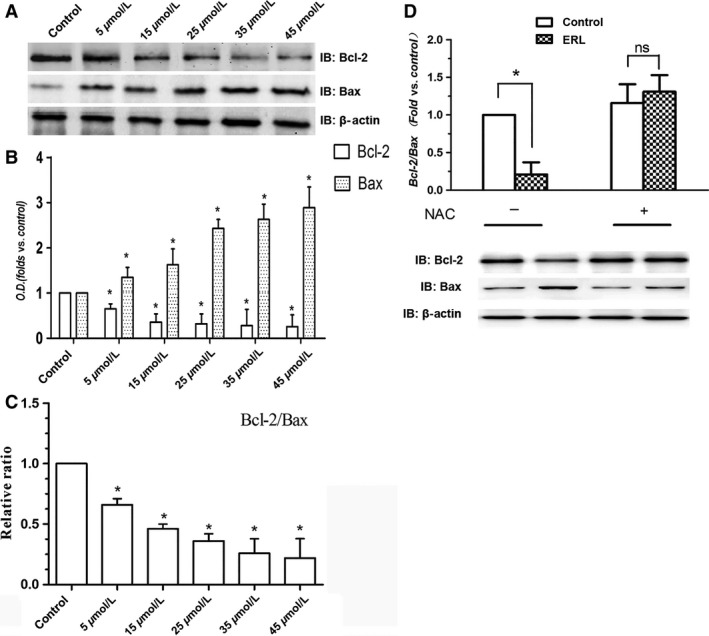
Effects of ERL on the expression of Bcl‐2 and Bax in A549 cells. (A) A549 cells were treated with various concentrations of ERL (0, 5, 15, 25, 35, and 45 μmol/L), and the expressions of Bcl‐2 and Bax were detected by western blot. (B) The intensity of the bands was expressed as optical density (OD) analysis. (C) The relative ratio of Bcl‐2/Bax protein levels was reduced as A549 cells were coincubated with increasing concentrations of ERL. (D) The effect of NAC on ERL‐induced changes on the ratio of Bcl‐2/Bax. Data were presented as mean ± SD. *P < 0.05 relative to control group, ns: no significant differences. ERL, erlotinib; NAC, N‐acetylcysteine.