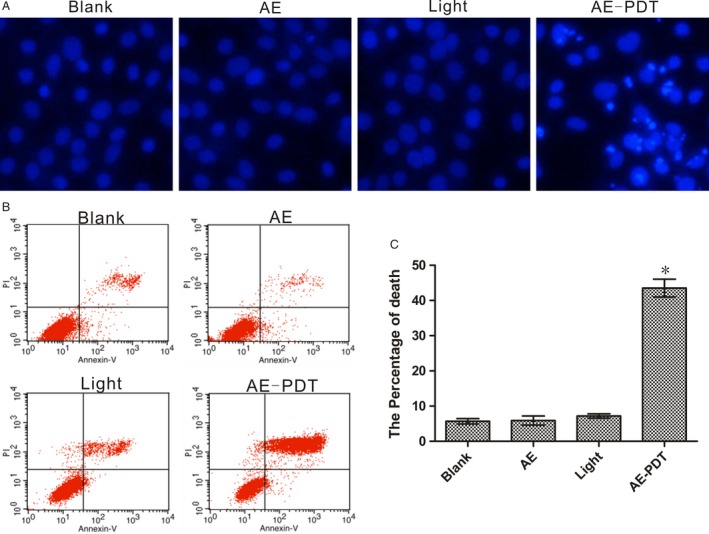
Figure 2.

AE‐PDT‐induced death on MG63 cells. (A) Cell apoptosis revealed by Hoechst 33,342 staining of fragmented nuclei of apoptotic cells. (B) Quantified analysis of the extent and mode of cell death percentage by flow cytometer. *P < 0.01, AE‐PDT group versus the three control groups. Values are mean ± SD of three independent determinations.
