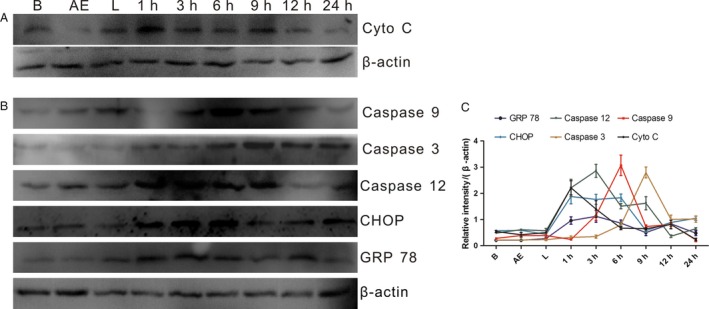
Figure 5.

The proteins Expression of Cytochrome c, Caspase 9, 12, 3, CHOP and GRP 78. (A) Effect of Aloe‐emodin (AE) on mitochondrial‐related protein expression; (B) Effect of AE‐PDT on ER stress‐related protein expression. (C) Quantitative analysis of protein expression according to panels (A and B). The vertical axis represents the protein expression relative to β‐actin. Data represent means ± SDs (n = 3). B means blank control group, AE means single AE group, L means single light group, 1–24 h means 1–24 h post‐PDT.
