Figure 1.

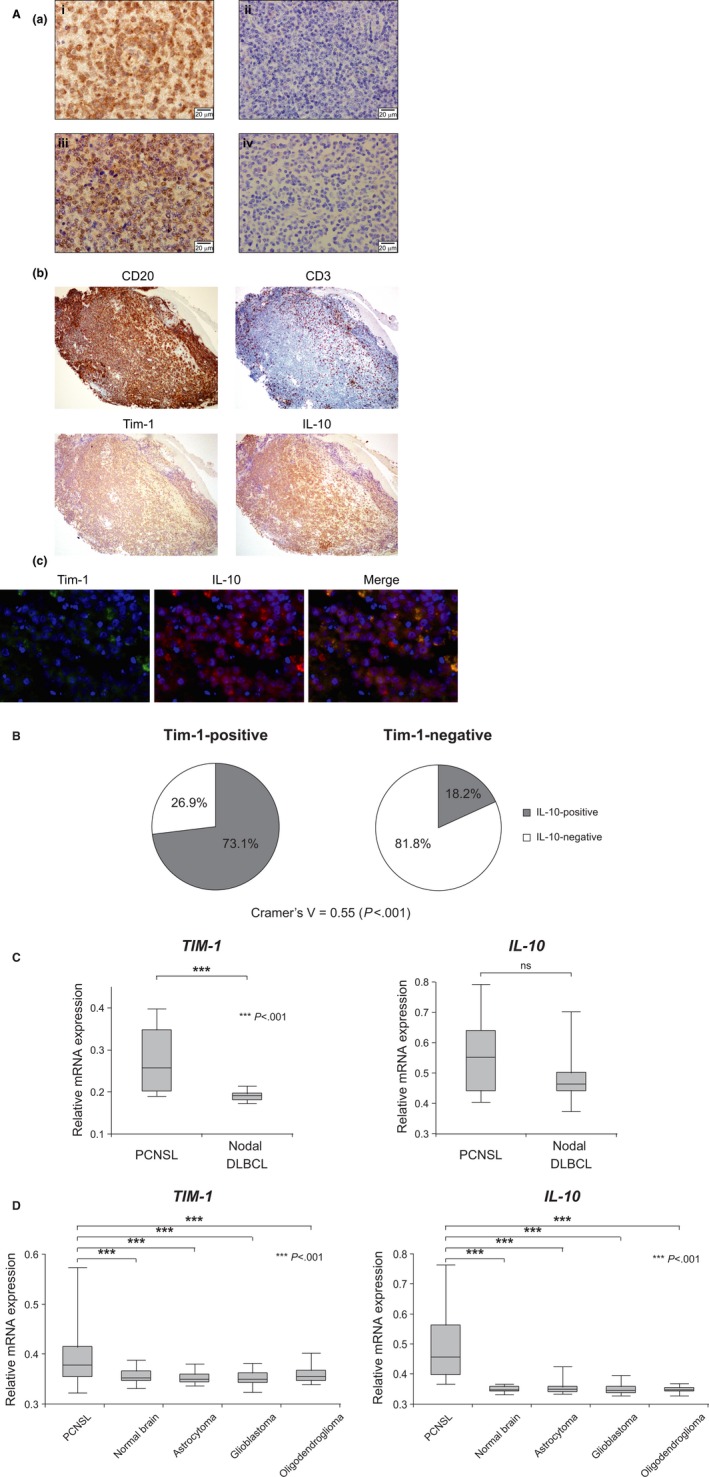
Increased expression of Tim‐1 in PCNSL. (A) (a) Representative immunohistochemical staining patterns of the (i) Tim‐1‐positive and (ii) ‐negative samples, and (iii) IL‐10‐positive and (iv) ‐negative samples (original magnification, ×600). (b) Representative results of the immunohistochemical staining of the serial sections of PCNSL samples (original magnification, ×100). (c) the fluorescent double staining for Tim‐1 and IL‐10 of PCNSL. (B) Pie charts showing IL‐10‐positive rates in the Tim‐1‐positive (left, n = 26) and ‐negative (right, n = 22) samples. (C) Comparison of the gene expression levels of TIM‐1 and IL‐10 between PCNSL (n = 9) and nodal DLBCL (n = 15) samples using microarray datasets available in the NCBI GEO database (accession number: GSE10524). (D) Comparison of the gene expression levels of TIM‐1 and IL‐10 between PCNSL (n = 34), normal brain (n = 23), astrocytoma (n = 26), glioblastoma (n = 81), and oligodendroglioma (n = 50) samples using microarray datasets available in the NCBI GEO database (accession numbers: GSE4290 and GSE34771). DLBCL, diffuse large B‐cell lymphoma.
