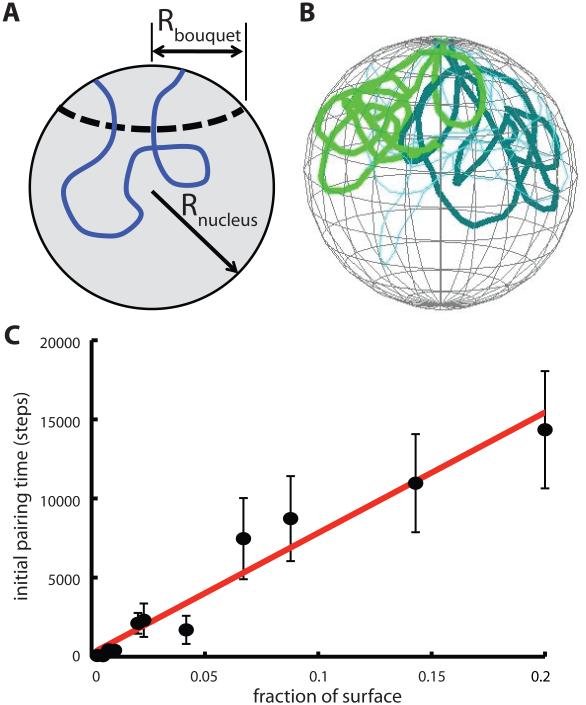
Figure 6.
Effect of telomere clustering on pairing kinetics. (A) Diagram showing geometry of nuclear patch representation for telomere clustering. (B) Snapshot from simulation showing initial configuration of chromosomes with telomeres clustered in a patch on the NE surface. (C) Graph depicts time for initial pairing versus the size of the clustering patch, given as a fraction of the total NE surface area. Error bars are standard error of the mean pairing time. Line depicts best fit line to pairing time versus fraction of surface contained in patch.

