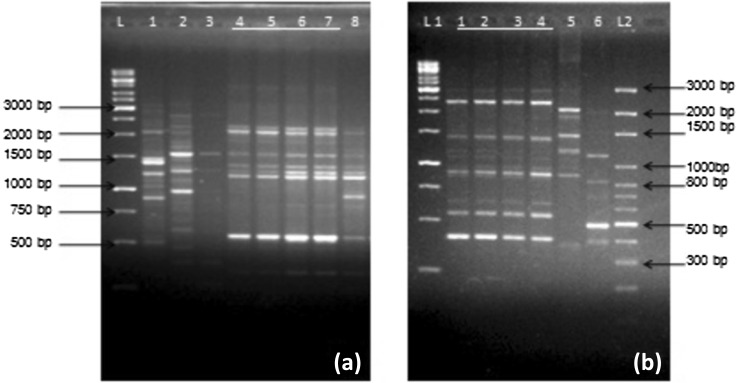
Fig. 2.
RAPD gel for P. dispersa and E. faecium. a Lane L represents 1 Kb DNA marker; lanes 1–8: RAPD profiles of isolates where 5, 6 and 7 represents same profile as P. dispersa (lane 4) showing amplified fragment size ranging from 300 to 2000 bp. b Lane L1 represents 1 Kb and L2 represents 100 bp DNA marker; lanes 1–6: RAPD profiles of the isolates, where 2, 3, 4 represents same profile as E. faecium (lane 1) showing amplified fragment size ranging from 400 to 2500 bp

