Fig. 3.

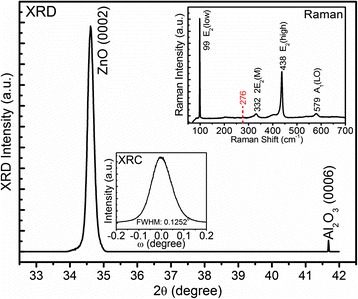
The XRD ω-2θ pattern of the N-doped ZnO MRs. The two insets depict the XRC of ZnO (0002) peak and the Raman spectra recorded at room temperature, respectively

The XRD ω-2θ pattern of the N-doped ZnO MRs. The two insets depict the XRC of ZnO (0002) peak and the Raman spectra recorded at room temperature, respectively