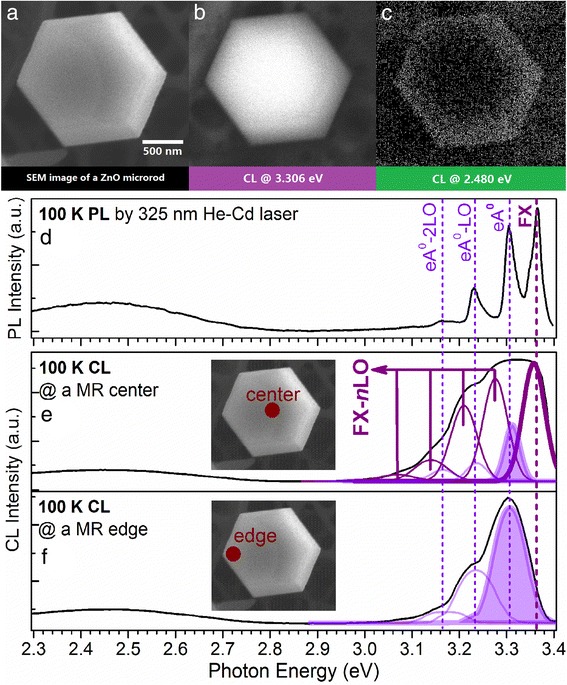
Fig. 6.

The SR-CL spectra and monochromatic images of a single N-doped ZnO MR performed with an accelerating voltage of 15 kV at 100 K. a The top view SEM image of the selected MR. b The CL monochromatic mapping of the MR taken at 3.306 eV. c The CL monochromatic mapping of the MR taken at 2.480 eV. d The PL spectrum measured at 100 K. e The CL spectrum obtained in spot mode from the center of the MR. f The CL spectrum obtained in spot mode from the edge of the MR
