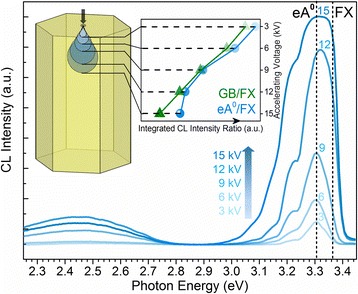
Fig. 7.

The CL spectra taken at 100 K in spot mode at the center of the N-doped ZnO MR with five different acceleration voltages of 3, 6, 9, 12, and 15 kV. The inset shows the integrated intensity ratio of eA0/FX and GB/FX as a function of the accelerating voltage (i.e., detection depth)
