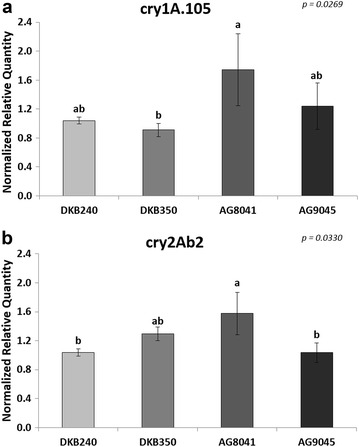
Fig. 4.

mRNA accumulation levels of transgenic transcripts among MON-89Ø34-3 maize varieties. a cry1A.105 transgene; b cry2Ab2 transgene. Vertical bars indicate standard deviation. Different letters above the bars indicate statistical differences among the samples at p < 0.05. Exact p value for the statistical test is shown on the right upper corner
