FIGURE 5.

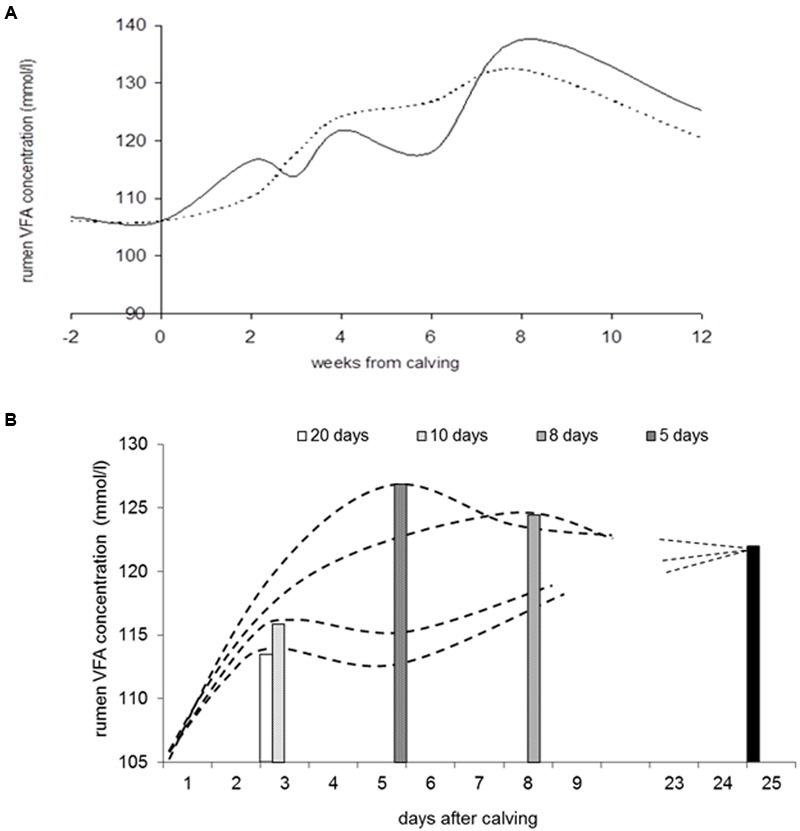
Response in rumen VFA concentration with increment of concentrate allowance after calving (results reproduced from Bannink et al., 2012). (A) Observed development in rumen VFA concentration with two rates of daily increment in concentrate allowance after calving to a maximum of 12 kg concentrate DM/d (in 10 days, solid curve; in 20 days, dashed curve). (B) Predicted development in rumen VFA concentration when increasing concentrate allowance to a maximum of 12 kg DM/d in 5, 7.5, 10, or 20 days after calving. The model describes rumen VFA absorption, growth of epithelial mass and surface area, epithelial VFA metabolism and VFA transport to portal blood in response to rumen VFA production. The model was calibrated using the trial for which results are depicted in (A), including estimated rumen VFA production rate and observations on rumen epithelial tissue development. Bars indicate the moment maximum VFA concentration is achieved during the various strategies of increment of concentrate allowance; the black bar indicates steady-state VFA concentration achieved at 25 days after calving.
