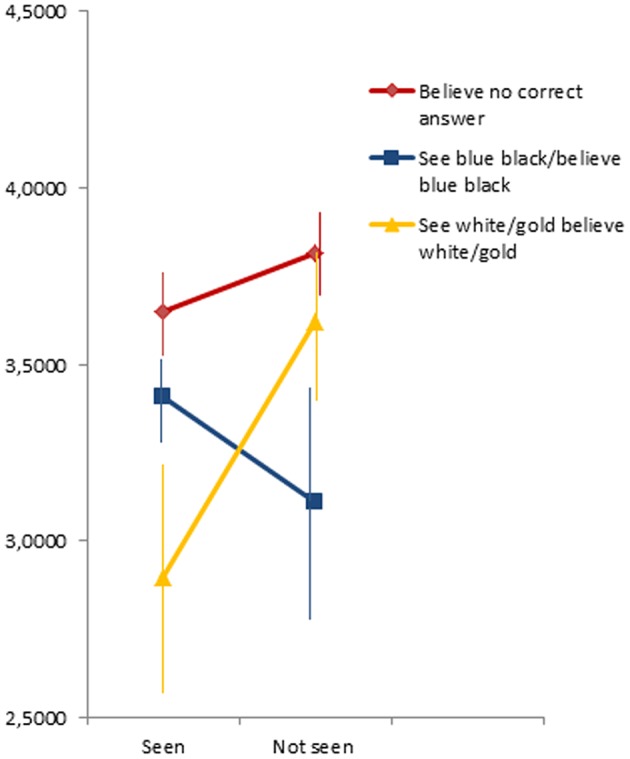
FIGURE 2.

Mean optimism scores, with error bars (standard error), for participants who had seen, or not seen, The Dress before and either believed “there is no correct answer” or showed consistency between their perception (“What colors do you perceive the dress to have?”) and their belief (“What is the correct answer?”) about The Dress’ colors. These last participants are, for comparison, split up into participants who consistently choose either “blue and black” or “white and gold.”
