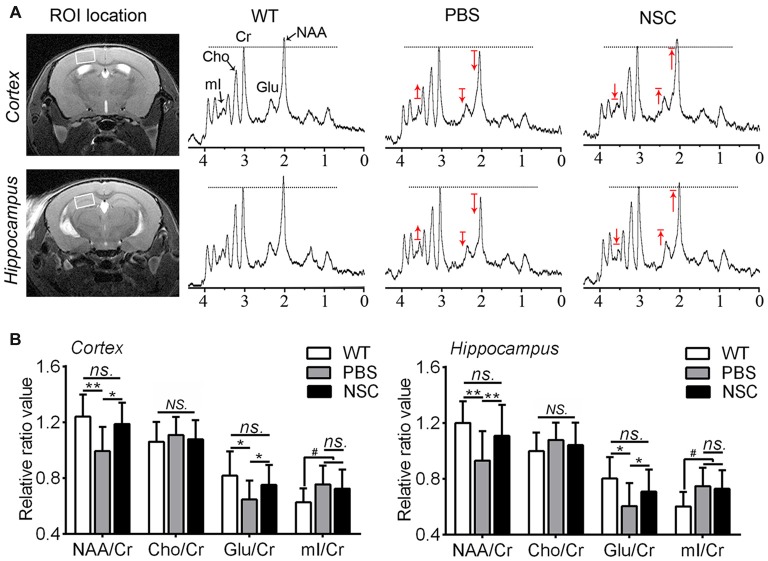
Figure 7.
hNSCs improved brain metabolic activity in APP/PS1 mice. (A) Regions of interest (ROI) location in the brain (white box) and representative spectra from NSC, PBS group and WT mice. N-acetylaspartate (NAA) and Glu peaks are lowered while myo-inositol (mI) is elevated in the frontal cortex and hippocampus of PBS group mice compared with WT group; hNSCs increased NAA, Glu but decreased mI in AD mice compared with PBS treatment. The red arrow indicates direction of metabolic changes whereas line represents the control level of each metabolite. (B) Quantification of the relative ratios of each metabolite to creatine (Cr) in the cortex and hippocampus of three groups of mice. There was no significant difference in NAA/Cr and Glu/Cr between the NSC group and WT mice and no difference in mI/Cr between the NSC and PBS group (ns. = p > 0.05), #p < 0.05 vs. WT mice; *p < 0.05, **p < 0.01 vs. the PBS group. No significant difference in Cho/Cr was found among three groups of mice (NS. = p > 0.05).

