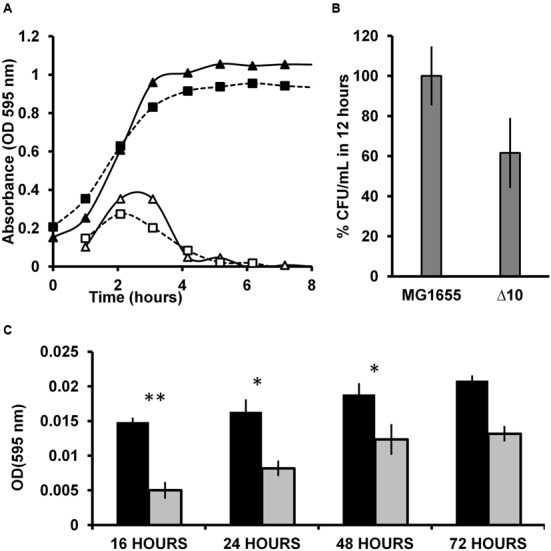
FIGURE 4.

(A) Growth curve of MG1655 and Δ10 strains. 2 μL of the diluted cultures were inoculated into 200 μL of LB in microtitre plate wells in triplicates. The microtitre plates were incubated at 37°C with 170 rpm shaking. Optical density at 595 nm was measured in a microtitre plate reader (BioradTM). The closed triangles and closed squares represent the OD of MG1655 and the Δ10 strains respectively. The open triangles and open squares represent the growth rates (change in OD per hour) of MG1655 and the Δ10 strain respectively. (B) Percent CFU in optimal conditions in 12 h. Overnight cultures were incoculated into tubes containing 3 ml LB broth and grown at 37°C with 170 rpm shaking for 12 h. 10 μL of the culture was diluted appropriately and plated on LB plates and incubated overnight. (C) Biofilm assay for prolonged duration. 2 μL of inoculum was added into 200 μL of LB broth in 96-well microtitre plate. The plates were incubated at 37°C for 16, 24, 48, and 72 h. The plates were washed and stained with 1% crystal violet. Then washed thrice and the bound crystal violet was redissolved using ethanol and OD was measured at 595 nm. Experiments were carried out independently thrice in quadruplicates. Error bars indicate standard error. (Two tailed ∗∗P < 0.001, ∗P < 0.01).
