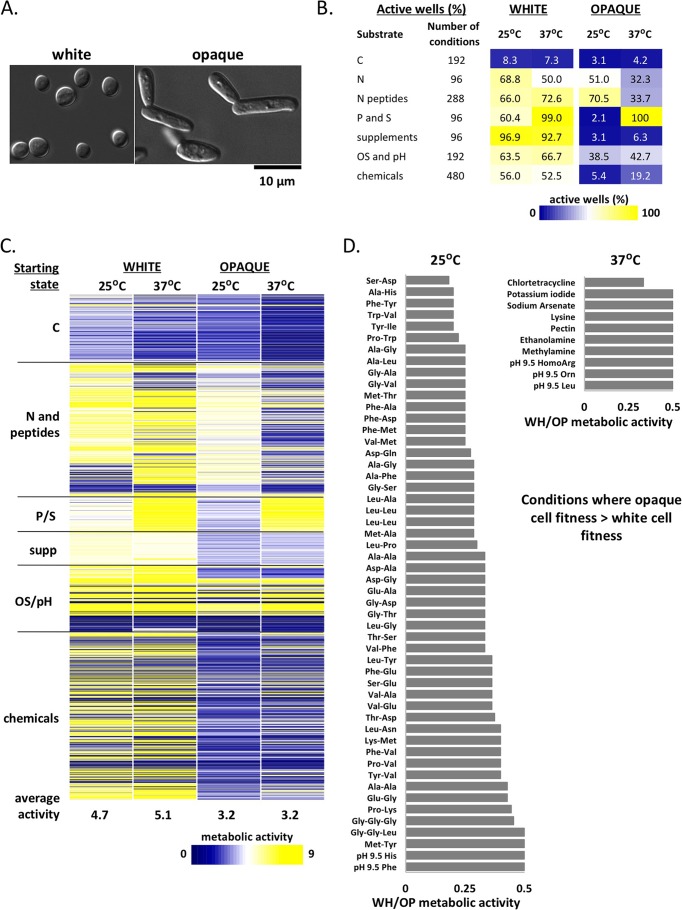
FIG 1 .
Metabolic profiling of wild-type white and opaque cells. (A) Cell morphologies of white and opaque cells. (B) Percent active wells (metabolic activity of ≥5) for each substrate group for white and opaque cells at 25°C and 37°C. (C) Heat map of metabolic activities of white and opaque cells grown at 25°C and 37°C in Phenotypic MicroArray (PM) conditions. Metabolic activity is represented on a scale from 0 (no growth [blue]) to 9 (maximum growth [yellow]). Substrate groups are C sources (PM01 and PM02), N and peptide sources (PM03 and PM06 to PM08), P and S sources (P/S) (PM04), supplements (supp) (PM05), osmotic stress and pH substrates (OS/pH) (PM09 and PM10), and chemicals (PM21 to PM25). Average metabolic activities across all conditions for each starting state are shown at the bottom of the heat map. (D) Conditions in which opaque cells grow better than white cells based on white cell/opaque cell (WH/OP) metabolic activity ratios that were ≤0.5.

