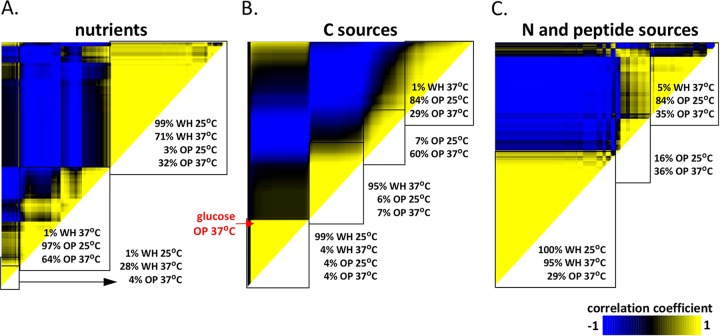
FIG 5 .
Hierarchical clustering analysis (HCA) reveals that white and opaque cells exhibit distinct phenotypic traits in response to many different nutritional cues. HCA of the four experimental data sets (white cells and opaque cells at both 25°C and 37°C) evaluates metabolic activities, filamentation phenotypes, and white-opaque switching data. HCA results are shown as heat maps populated with Pearson product moment correlation coefficients (−1 to 1) between any two conditions. The effects of different substrates on phenotypic outputs were examined for all “nutrients” (PM plates PM01 to PM08) (A), C sources (PM plates PM01 and PM02) (B), and N and peptide sources (PM plates PM03 and PM06 to PM08) (C). Division of clusters was assigned based on clustergram linkage, and only first- and second-order clusters are shown as a percentage of conditions for each starting state. Substrates with a 0 correlation coefficient generally showed no growth under these conditions.

