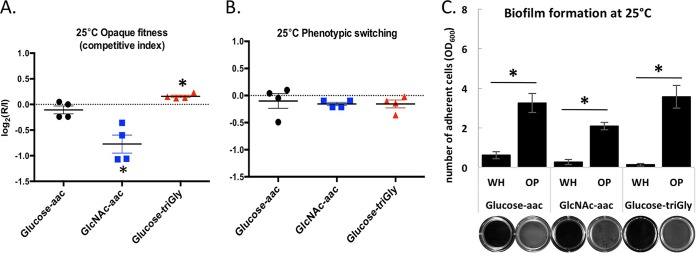
FIG 9 .
Metabolic rewiring of white and opaque cells impacts fitness and biofilm formation outcomes. (A and B) Growth in a mixed population of wild-type white and opaque cells on different C and N sources at 25°C. Cells were grown for 24 h on minimal medium with glucose and amino acids (aac), GlcNAc and amino acids, or glucose and triGly (Gly-Gly-Gly) without amino acids. Histograms show the opaque competitive index and the rate of phenotypic switching calculated as the log2(R/I). R represents the recovered opaque population after 24 h growth starting from a 1:1 white-opaque mix as the initial population (I). Relative changes were calculated using genetic selection (A) (either the white or opaque cell type carried a resistance marker while the other cell type did not) or visual inspection of colony morphologies (B) (by plating cells at the end of the 24-h period). Asterisks denote significant differences (P < 0.05) relative to the initial population. (C) Biofilm formation by white and opaque wild-type cells grown on different C and N sources at 25°C. Cells were grown on Lee’s medium with glucose and amino acids, Lee’s medium with GlcNAc and amino acids, or Lee’s medium with glucose and triGly without amino acids. Histograms show OD600 values following resuspension of adherent cells after 24 h of growth. The images below the bars show representative wells, and asterisks denote significant differences (P < 0.05) between cell types.

