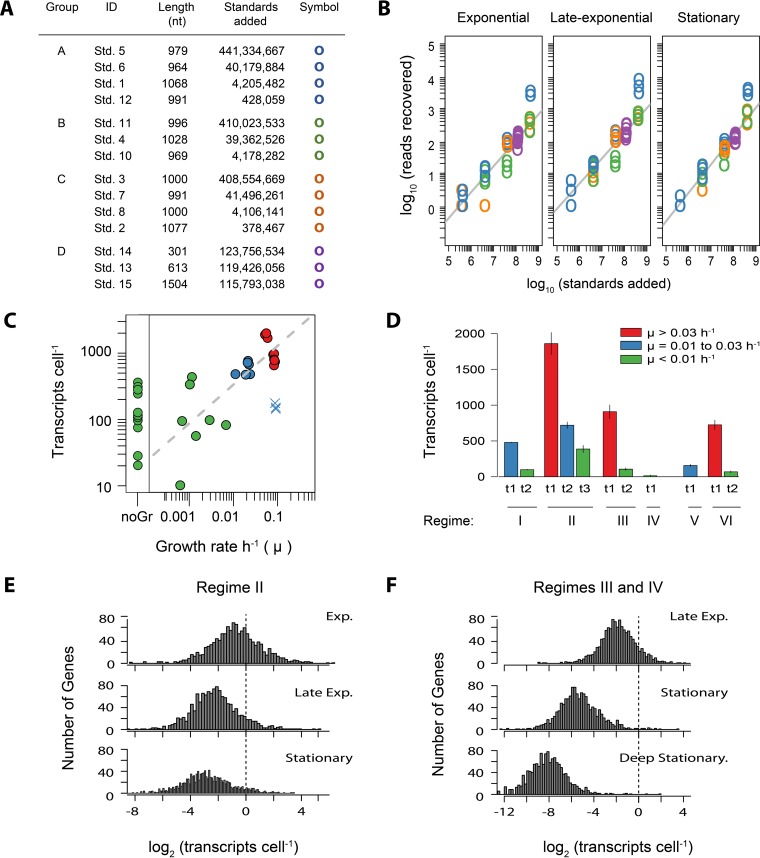
FIG 3 .
(A) Internal RNA standard statistics and groupings. ID, the standard identifier; length, total number of nucleotides in a standard; standards added, the final number of standards added to each sample; symbol, the plotting symbol in the graph. (B) The recovery of internal standards in the sequence libraries versus the number of standards added for samples collected over three different growth phases in the nutrient- and methanol-amended regime (II). The grey line is the fitted linear regression. Plots of standard recovery for all 33 samples are provided in Fig. S2. (C) Relationship between the total mRNA content per cell as estimated from internal standard recovery and the culture growth rate at the time of sampling. Points are colored as indicated in the legend to panel D. The time points at which growth was zero or cell densities were decreasing were binned into “noGr.” Regime V (UV-oxidized medium not nutrient amended plus HMW DOM) had relatively low temporal resolution of cell concentrations just before transcriptome sampling, causing the sampling time points to have an overestimate of the growth rate and were therefore considered outliers (plotted as blue ×s). (D) Total cellular transcript abundances by experiment and sampling time point (t1 to t3), as shown by the arrows in Fig. 1. (E, F) Distribution of transcript abundances in OM43 strain NB0046 during different phases of growth. The dashed line indicates the number of genes with one transcript cell−1. Exp., exponential growth phase; late exp., late-exponential growth phase; Deep Stationary., cultures in the stationary phase for an extended period of time.

