
Figure 4.
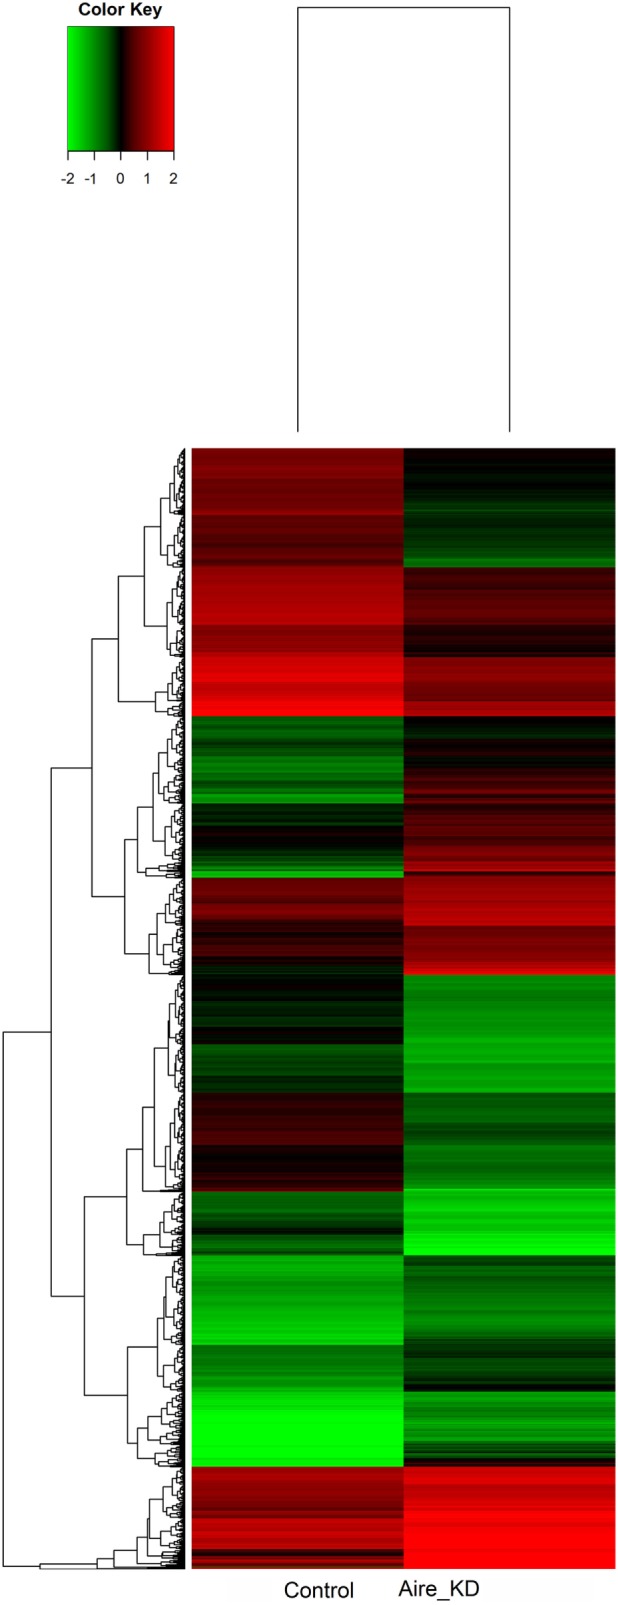
Hierarchical clustering and color heat-map of mRNAs differentially expressed comparing control to Aire-knockdown mTEC cells. The dendrogram and heat-map were obtained using cluster and treeview algorithms through Agilent GeneSpring platform. Heat-map color legend: red, upregulation, green, downregulation, black, unmodulated (Pearson correlation metrics, fold-change ≥1.5, FDR 0.01). KD, knockdown.