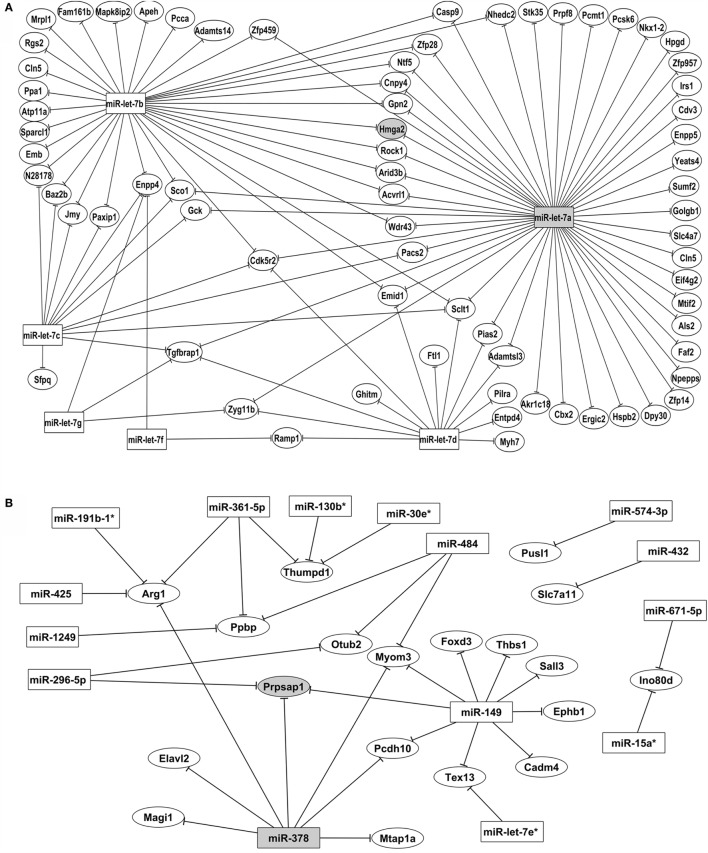
Figure 5.
Posttranscriptional miRNA–mRNA interaction network based on microarray expression data. The network of control mTEC cells (A) shows the participation of six miRNAs of let-7 family that interact with PTA mRNAs targets. The highlighted interaction (let-7a–Hmga2 mRNA) was selected for further validations. The network of Aire-knockdown mTEC cells (B) shows the participation of 15 miRNAs from different families that interact with a restricted group of PTA mRNA targets. The highlighted interaction (miR-378–Prpsap1 mRNA) was selected for further validations. Interaction networks were reconstructed by using the GenMir++ algorithm, which consider the respective modulation of miRNAs (upregulated) and of mRNA targets (downregulated).

