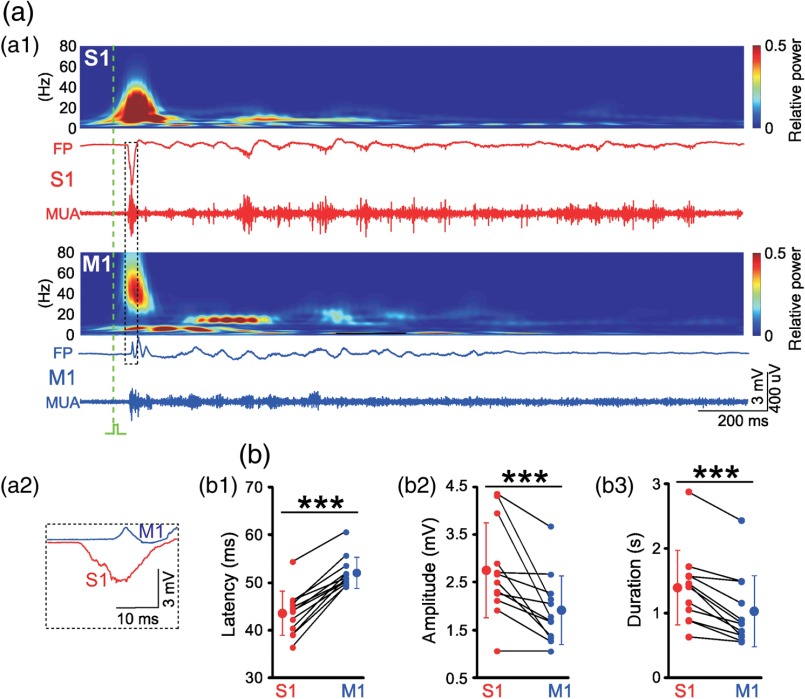
Fig. 4.
Electrophysiological responses in S1 and M1 to mechanical forepaw stimulation. (a1) Burst responses in S1 (red) and M1 of a P4 rat. Wavelet analyses above are calculated from the unfiltered LFP recordings and MUA is high-pass filtered (). Time point of forepaw stimulation is indicated by green dashed line. (a2) Evoked response in S1 precedes response in M1. (b1) Average statistical onset latency, (b2) maximal amplitude, and (b3) duration of forepaw-evoked LFP responses ( P3–P5 rats). Note similar properties of electrophysiological responses to VSD responses shown in Figs. 3(c) and 3(d). Small symbols connected by black lines represent the individual animals. Larger symbols express . Significant differences between S1 and M1 at (***) as tested with Mann–Whitney–Wilcoxon test. Modified from Ref. 35.

