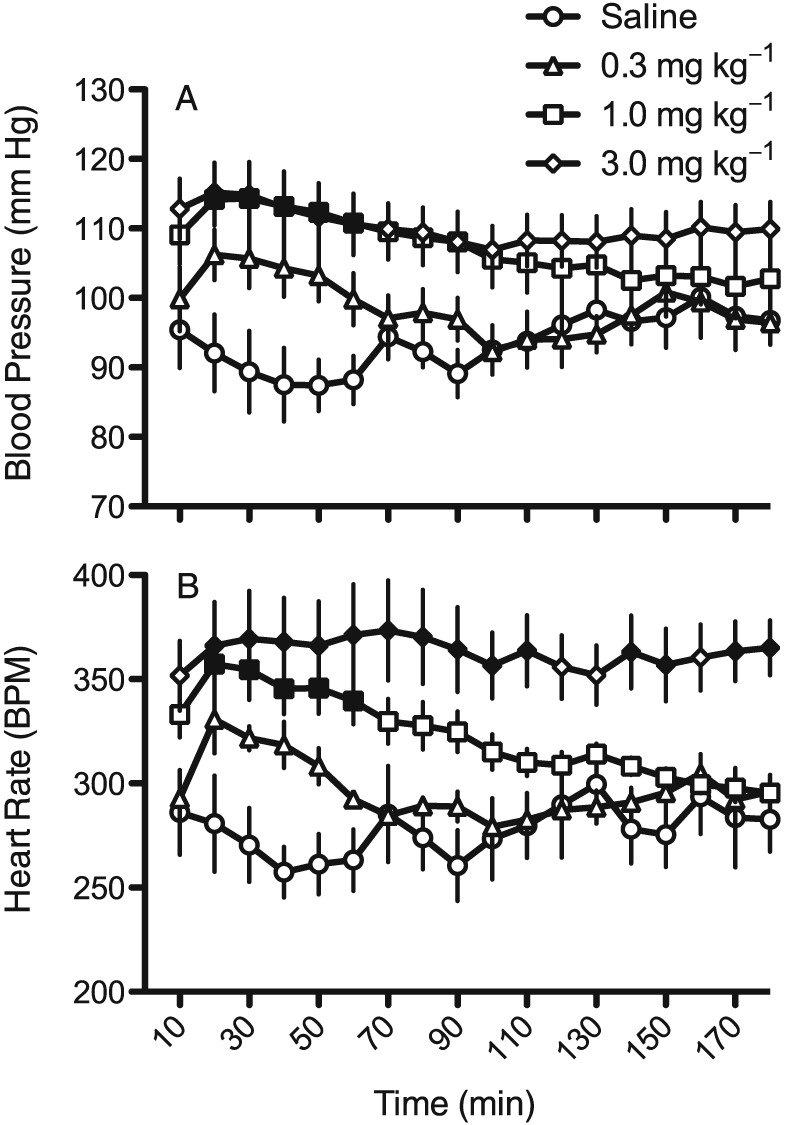
Figure 1.

Time course for the effects of saline and three doses of racemic MDPV on BP (A) and in (B) HR (as beats min‐1; BPM). Each point represents a 10 min mean ± SEM (n = 6), and solid symbols are significantly different (P<0.05) compared with the same time point for saline administration.
