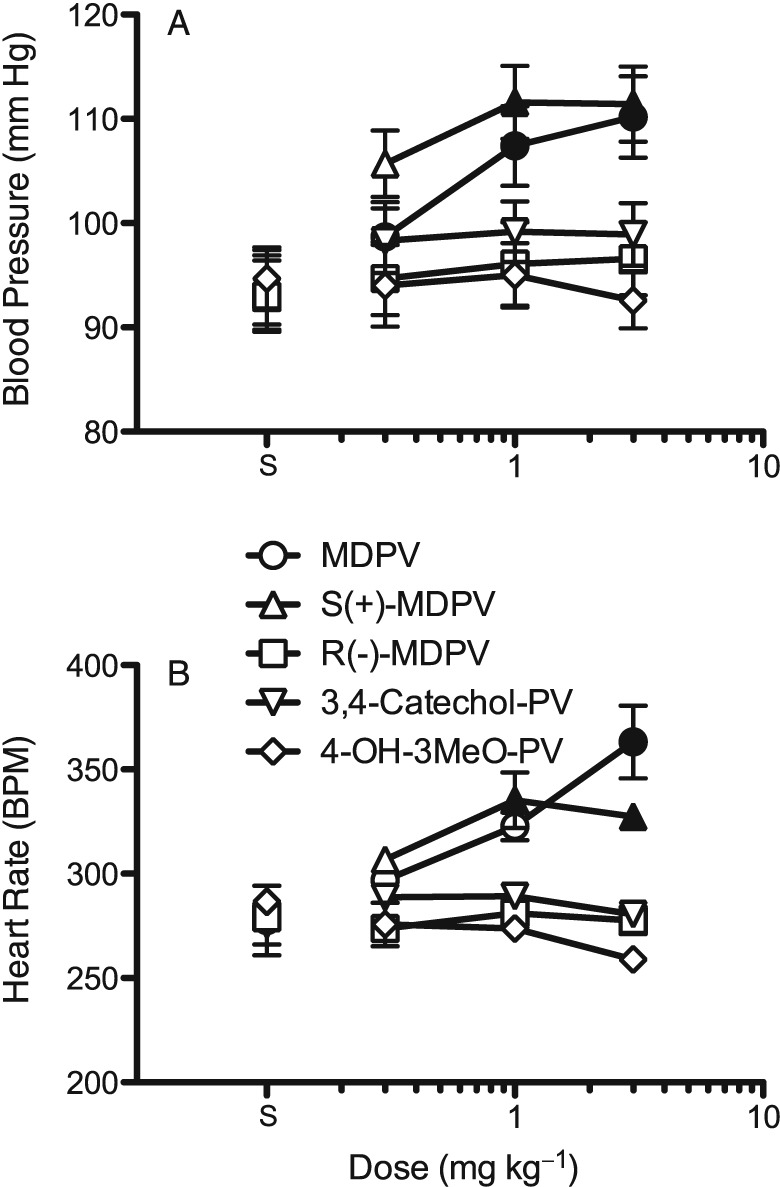
Figure 2.

Dose‐effect functions for racemic MDPV, the MDPV enantiomers and the MDPV metabolites on BP (A) and in (B) HR (as beats min‐1; BPM). Each point represents the mean ± SEM (n = 6) for the entire 3 h session. Solid symbols indicate significant difference (P<0.05) from the respective saline controls (points above ‘S’). Only racemic MDPV and the S(+) enantiomer increased BP and HR.
