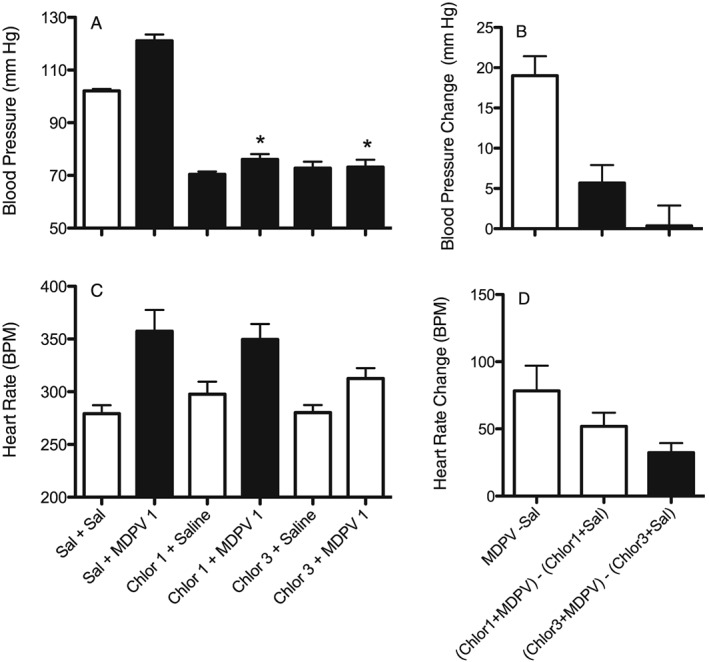
Figure 3.

Effects of MDPV (1 mg·kg−1) on BP (A and B) and in (C and D) HR (as beats min‐1; BPM), alone and after pretreatment with the ganglionic blocker chlorisondamine (1 and 3 mg·kg−1). A and C show actual results for each individual treatment. Dark bars are treatments that are significantly different (P < 0.05) from the saline + saline control (Sal + Sal). *P<0.05, significant difference between chlorisondamine + MDPV compared with MDPV alone. B and D show change scores whereby effects of saline or chlorisondamine + saline are subtracted from the effects of the corresponding MDPV treated group. Dark bars are significantly different (P<0.05) from MDPV 1 – Saline. Each bar is mean ± SEM (n = 7) for the first hour of the session.
