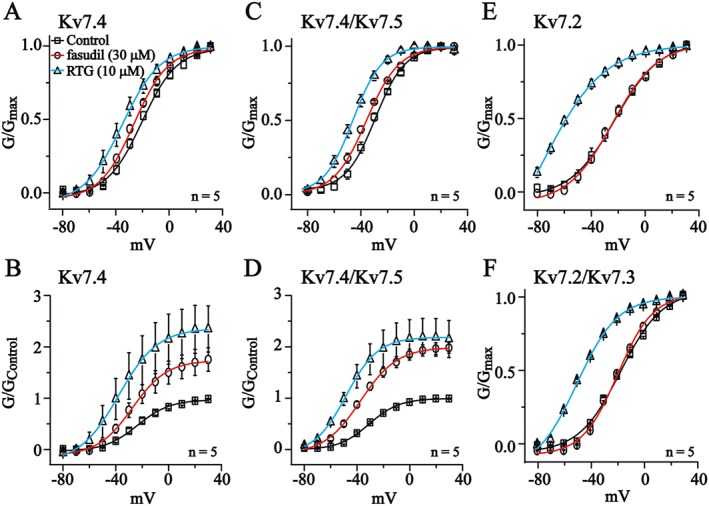
Figure 4.

The effects of fasudil on voltage‐dependent activation of Kv7 currents in HEK293 cells. The currents were recorded using the voltage protocol shown at the top of Figure 1C. Voltage‐dependent activation curves were plotted from the tail currents recorded at −60 mV against the preceding voltage step. In (A, C, E and F), the currents (G) were normalized to the maximum value of each group. In (B and D), the currents were normalized to the control maximum value. The data were fitted with a Boltzmann function described in the Methods section; n = 5.
