
Figure 6.
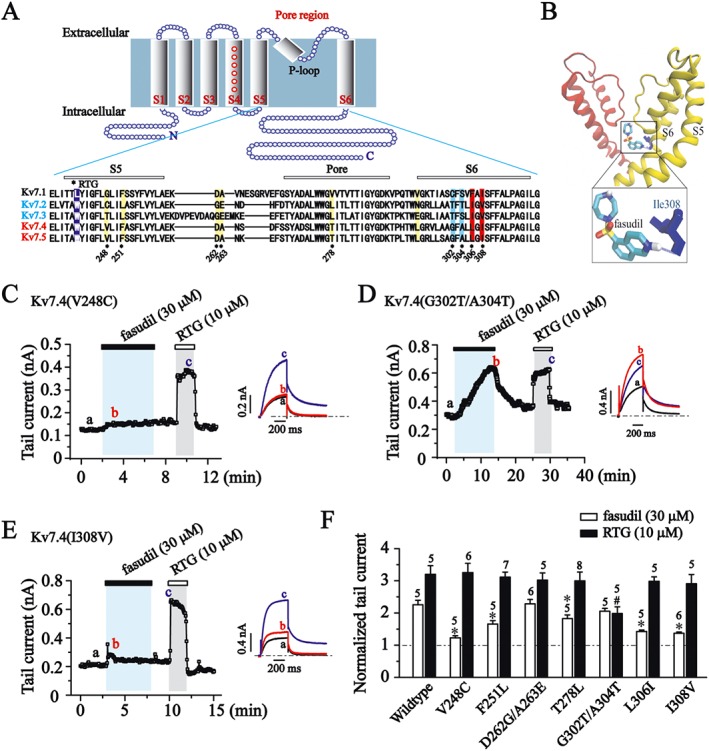
Molecular determinants for fasudil sensitivity. (A) Kv7 cartoon diagram. Transmembrane segments are labelled S1–S6. Alignment of the pore regions of Kv7.1 to Kv7.5 (KCNQ1–5). RTG binding sites are labelled with the violet band, and residues that are different between Kv7.4/Kv7.5 versus Kv7.2/Kv7.3 in the S5 segment and pore region are labelled with a yellow band. Residues Gly302, Ala304, Leu306 and Ile308 in the S6 segment are labelled with blue or red band. (B) Docking result for the binding of fasudil within the pore domain of Kv7.4 (KCNQ4) channel. Two subunits are shown (yellow and red) of energy‐optimized homology models of the Kv7.4 pore domain derived from the crystal structures of KcsA. The hydrogen bond between fasudil and Ile308 in Kv7.4 (KCNQ4) channel is shown as a blue dotted line. Residue I308 is shown in blue. (C–E) The time courses for the effects of fasudil (30 μM) and RTG (10 μM) on Kv7.4 point mutants recorded at −60 mV. Each mutation site was indicated in (A). (F) Histogram shows the effect of fasudil (30 μM) and RTG (10 μM) on the tail currents of Kv7.4 point mutants (−60 mV). *P < 0.05 compared with the Kv7.4 wildtype currents in the presence of fasudil, #P < 0.05 compared with the Kv7.4 wildtype currents in the presence of RTG, n = 5–8 (one‐way ANOVA, Bonferroni post hoc test).